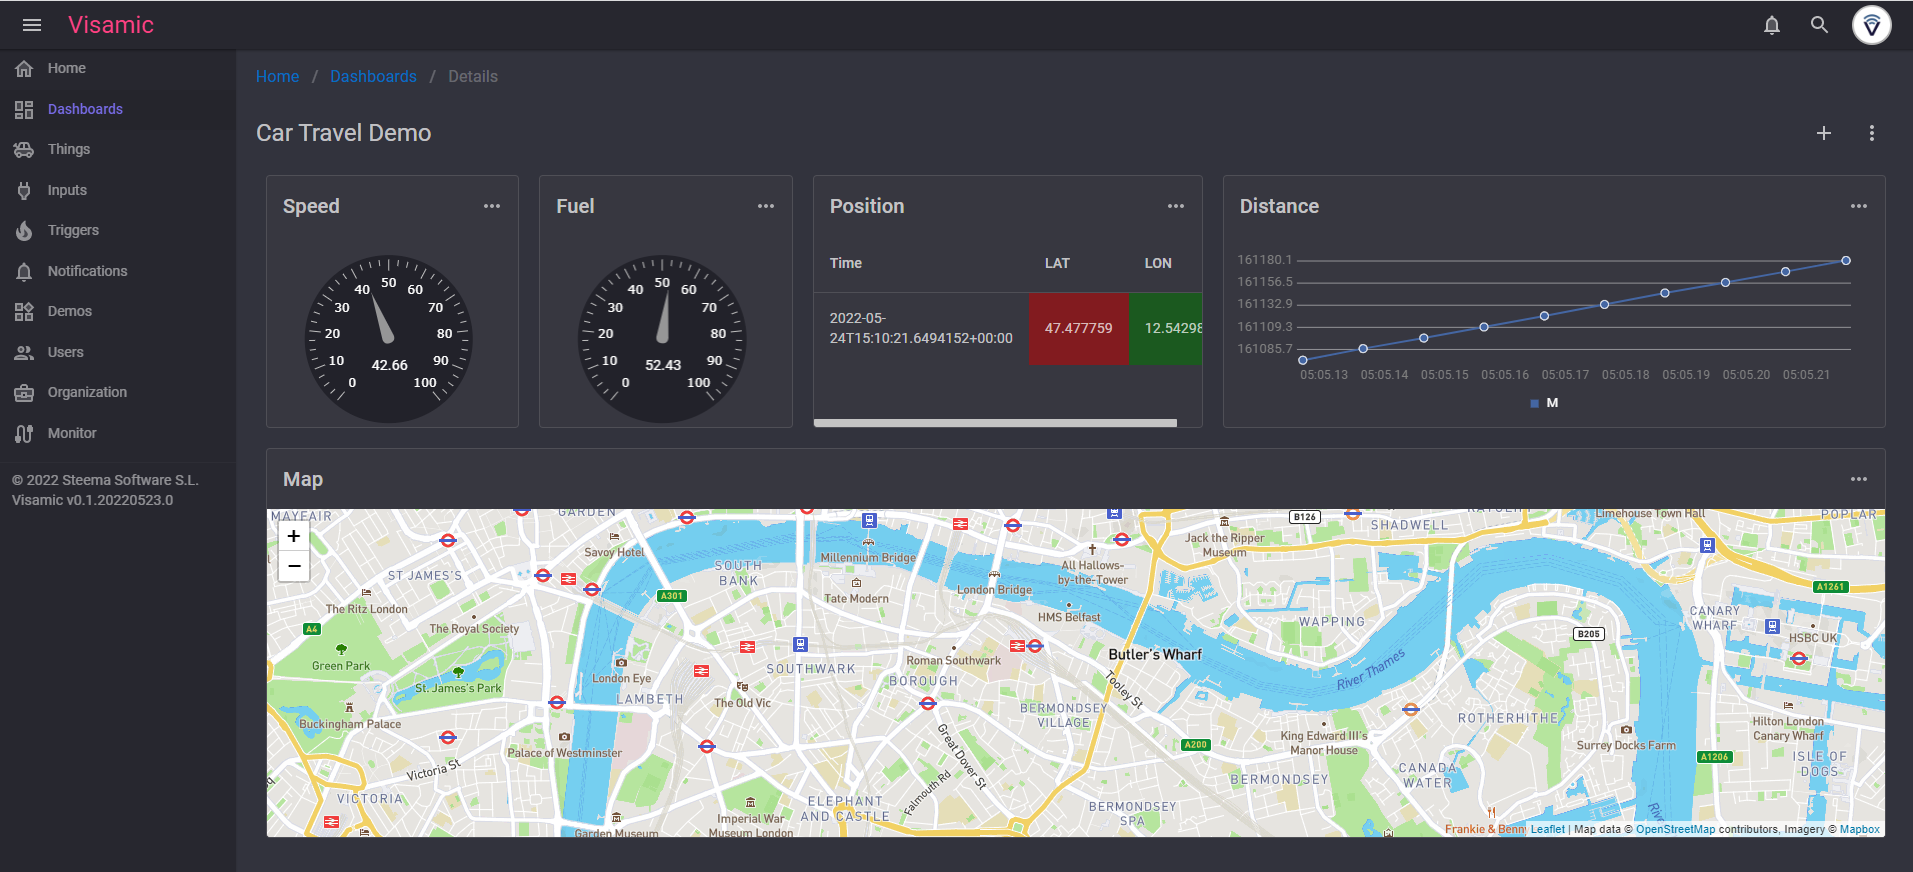
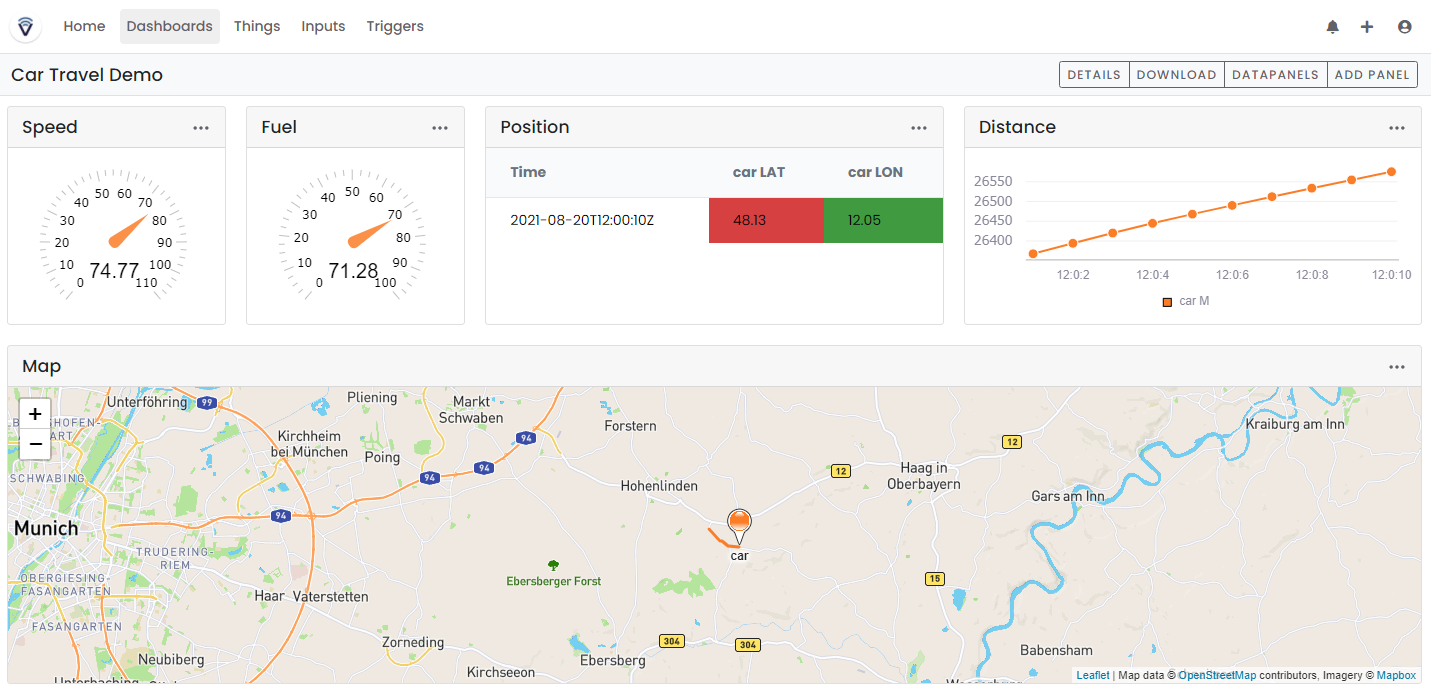
Visamic MQTT IoT Dashboard Service
The Visamic IoT Dashboard Web Service enables users to monitor and interact with connected things and sensors through charts and other data visualisations in real-time, for exploration and analysis.
Based on the industry standard MQTT protocol, it's available for you to set up a no-cost user account to try it out either with your own MQTT connected devices data or to view the prepared demos.
Visit the Visamic page to learn more.