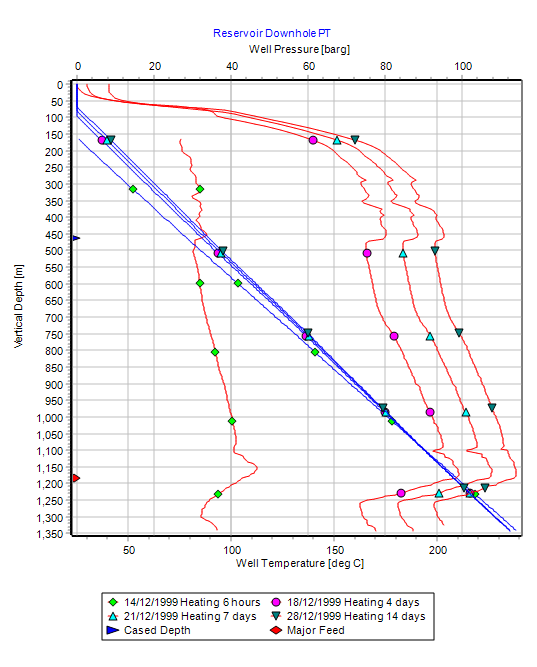
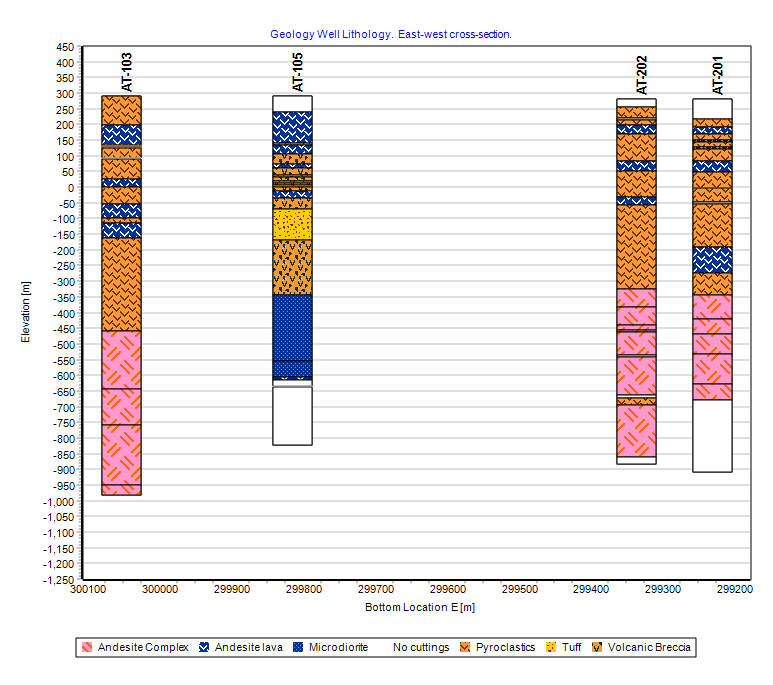
About GSDSOur business is geothermal: helping users plan, manage and develop geothermal resources by managing and interpreting the information from the steam and hot water wells drilled to generate electricity from volcanic heat in the earth.Describe your ApplicationWe sell three programs for geothermal resources:- WellSim is a wellbore simulator that models the flow of geothermal fluid in a well. This is written in Delphi and Fortran, with a strong graphical component using TeeChart. This is also database-driven, using Access or SQL Server. Product page www.gsds.co.nz/wellsim - GeoData Manager is a geothermal data management system, written in Delphi and Python, again with a strong graphical component using TeeChart. This uses a sophisticated database (either SQL Server or Access) which is both unit-aware (i.e. all data is stored in SI units, but can be entered and used in the measurement units of the user's choice), and spatially-aware (i.e. all data is automatically located in space and time). Product page www.gsds.co.nz/geodata-manager - SteamField Manager handles day-to-day operation of the wells and power plant. Product page www.gsds.co.nz/steamfield-manager All three applications present large amounts of data to a user, and for this we must show pictures - graphs - rather than lists of numbers. Why did you choose TeeChart?When we decided to convert our applications from DOS to Windows in 1997, TeeChart was the best charting tool available for Delphi, our preferred IDE platform. We wanted to fully embed the charting in the application, rather than interface via ASCII files as for the DOS application, and TeeChart offered this.Describe a specific project challenge your company overcame using TeeChartOur applications present a wide variety of graphs, and we regularly add new kinds of graphs. Yet the user must be able to customise each graph to suit their needs: what data is displayed, what the axes are, axis units, zoom level, line and point colour and style. TeeChart gives this flexibility to both the developers and the users.What benefits have you experienced from using TeeChart?- TeeChart is stable and has been well supported, with frequent upgrades and development of new chart types.- TeeChart has built in options to export graphs in a variety of formats. - Good online support from the TeeChart forum. Errol Anderson Geothermal Resource Analyst | Software Development GSDS Ltd www.gsds.co.nz 
|


