Hi,
I am mapping tchart.Axes.Left axis and adding custom labels to it.
Problem:
1) The formatting which is applying on custom label, same are also get
applied on axis title. Title should be of differently formatted.
2) Title almost coming nearby or on the axis. It should be away from axis
labels.
Here is code:
Axis ZAxis = tchart.Axes.Left;
ZAxis.Title.Text = "Test";
ZAxis.Title.Font.Name = "Arial";
ZAxis.Title.Font.Size = 20;
ZAxis.Title.Font.Color = Color.Blue;
ZAxis.Title.TextAlign = StringAlignment.Center;
ZAxis.SetMinMax(0,100);
ZAxis.Labels.Items.Clear();
double start = 0.0;
double end = 100.0;
double majorGridPoint = 10.0;
int labelItemNo = 0;
while (start <= end)
{
ZAxis.Labels.Items.Add(start);
ZAxis.Labels.Items[labelItemNo].Font.Name = "ArialBlack";
ZAxis.Labels.Items[labelItemNo].Font.Size = 10;
ZAxis.Labels.Items[labelItemNo].Font.Color = Color.Green;
ZAxis.Labels.Items[labelItemNo].Font.Bold = true;
start = start + majorGridPoint;
labelItemNo++;
}
Note: Same code is working for tchart.Axes.Bottom and tchart.Axes.Depth
Thanks,
-Raed
Problem in axis title.
-
Narcís
- Site Admin

- Posts: 14730
- Joined: Mon Jun 09, 2003 4:00 am
- Location: Banyoles, Catalonia
- Contact:
Hi Raed,
I'm not able to reproduce the issue here using latest TeeChart for .NET v3 release available at the client area. Which TeeChart version are you using?1) The formatting which is applying on custom label, same are also get
applied on axis title. Title should be of differently formatted.
You can solve that using this:2) Title almost coming nearby or on the axis. It should be away from axis labels.
Code: Select all
ZAxis.Labels.CustomSize = 30;Best Regards,
| Narcís Calvet / Development & Support Steema Software Avinguda Montilivi 33, 17003 Girona, Catalonia Tel: 34 972 218 797 http://www.steema.com |
      |
| Instructions - How to post in this forum |
-
drillright40
- Newbie

- Posts: 57
- Joined: Mon Nov 19, 2007 12:00 am
Hi,
1) The formatting which is applying on custom label, same are also get
applied on axis title. Title should be of differently formatted.
For this, I tried with the new version also. Same problem is coming.
The scale label like 0,2,4,..., 20 should be in let say blue color
and title like "Z" should be in let say red color.
Meaning both should have different formatting.
-Raed
-
Narcís
- Site Admin
- Posts: 14730
- Joined: Mon Jun 09, 2003 4:00 am
- Location: Banyoles, Catalonia
- Contact:
Hi Raed,
That's what I got here using the code snippet you posted. Would you be so kind to send us a simple example project we can run "as-is" to reproduce the problem here?
You can either post your files at news://www.steema.net/steema.public.attachments newsgroup or at our upload page.
Thanks in advance.
That's what I got here using the code snippet you posted. Would you be so kind to send us a simple example project we can run "as-is" to reproduce the problem here?
You can either post your files at news://www.steema.net/steema.public.attachments newsgroup or at our upload page.
Thanks in advance.
Best Regards,
| Narcís Calvet / Development & Support Steema Software Avinguda Montilivi 33, 17003 Girona, Catalonia Tel: 34 972 218 797 http://www.steema.com |
| |
| Instructions - How to post in this forum |
-
drillright40
- Newbie
- Posts: 57
- Joined: Mon Nov 19, 2007 12:00 am
-
Narcís
- Site Admin
- Posts: 14730
- Joined: Mon Jun 09, 2003 4:00 am
- Location: Banyoles, Catalonia
- Contact:
Hi Raed,
Thans for the screenshot. Yes, I can see the problem there. However, to be able to find a solution we would need to reproduce the problem here and debug it so we would really appreciate if you could arrange a simple example project we can run "as-is" to reproduce the issue here.
Thanks in advance.
Thans for the screenshot. Yes, I can see the problem there. However, to be able to find a solution we would need to reproduce the problem here and debug it so we would really appreciate if you could arrange a simple example project we can run "as-is" to reproduce the issue here.
Thanks in advance.
Best Regards,
| Narcís Calvet / Development & Support Steema Software Avinguda Montilivi 33, 17003 Girona, Catalonia Tel: 34 972 218 797 http://www.steema.com |
| |
| Instructions - How to post in this forum |
-
drillright40
- Newbie
- Posts: 57
- Joined: Mon Nov 19, 2007 12:00 am
-
Narcís
- Site Admin
- Posts: 14730
- Joined: Mon Jun 09, 2003 4:00 am
- Location: Banyoles, Catalonia
- Contact:
Hi Raed,
Thanks for your project. Please find below the answers to your problems:
The problem is that that point doesn't keep the grid structure Surface series should have as I described here.
To achieve what you are trying to do you could try using 2 surface series. One for the "regular" points and the other for "center" points.
It would also help viewing the surface changing your elevation and rotation settings.
Since all Y values are the same in the surface, you may better use SetMinMax method combinded with Increment property to set left axis scale instead of using custom labels.
Thanks in advance.
Thanks for your project. Please find below the answers to your problems:
This is because of the "Center Point" addition, commenting in the line that adds that point makes the surface being displayed in the chart:1. Unable to draw surface with default color, even all the points(x,y,z) are properly added in surface class. (Look at view)
Code: Select all
                                        //Center Point
                                        #region Center Point
                                        double centerZVal = ((centerLeftZVal) + (centerTopZVal)) / 2;
																				//SurfaceSeries[surfaceIndex].Add(yValue, centerZVal, xValue, Convert.ToString(yValue));
                                        SurfaceSeries[surfaceIndex].Marks.Visible = true;
                                        SurfaceSeries[surfaceIndex].Marks.Font.Color = Color.Red;
#endregionTo achieve what you are trying to do you could try using 2 surface series. One for the "regular" points and the other for "center" points.
It would also help viewing the surface changing your elevation and rotation settings.
The difference here is that you use custom labels for chart's left axis. How would you exactly want labels to be displayed there?2. Unable to format Z-Axis labels like Y-Axis or X-Axis. (Look at view)
Since all Y values are the same in the surface, you may better use SetMinMax method combinded with Increment property to set left axis scale instead of using custom labels.
Sorry but I don't understand what do you mean here. Could you please give us some more details?3. Unable to format -ve scale labels on axis. (Look at view)
Thanks in advance.
Best Regards,
| Narcís Calvet / Development & Support Steema Software Avinguda Montilivi 33, 17003 Girona, Catalonia Tel: 34 972 218 797 http://www.steema.com |
| |
| Instructions - How to post in this forum |
-
drillright40
- Newbie
- Posts: 57
- Joined: Mon Nov 19, 2007 12:00 am
Quote 1: If I remove center points. I am able to draw the surface connecting points. But the problem is, it is not creating center line between each bin surface. So, I calculate center point also.
Quote 2: If I go for SetMinMax and increment property, whatever be the
minimum value, it is taking 0 on scale. I want to display given minimum value as start.
Example: SetMinMax(5,20)
Scale should be start from 5 and ends with 20.
So, I am using custom labels.
-Raed
Quote 2: If I go for SetMinMax and increment property, whatever be the
minimum value, it is taking 0 on scale. I want to display given minimum value as start.
Example: SetMinMax(5,20)
Scale should be start from 5 and ends with 20.
So, I am using custom labels.
-Raed
-
Narcís
- Site Admin
- Posts: 14730
- Joined: Mon Jun 09, 2003 4:00 am
- Location: Banyoles, Catalonia
- Contact:
Hi Raed,
This also depends on the increment you set for the axis, this works fine for me here:
I see, no surface pen lines are drawn for x value = 470 (your Y axis). We will investigate the issue here and will get back to you when we have further news.Quote 1: If I remove center points. I am able to draw the surface connecting points. But the problem is, it is not creating center line between each bin surface. So, I calculate center point also.
This works fine for me here using this code:Quote 2: If I go for SetMinMax and increment property, whatever be the minimum value, it is taking 0 on scale. I want to display given minimum value as start.
Example: SetMinMax(5,20)
Scale should be start from 5 and ends with 20.
This also depends on the increment you set for the axis, this works fine for me here:
Code: Select all
        private void DisplayZAxis()
        {
            //Z-Axis
            Steema.TeeChart.Axis ZAxis = ChartDisplay.Axes.Left;
            ZAxis.Title.Font.Name = "Arial";
            ZAxis.Title.Font.Size = 14;
            ZAxis.Title.Font.Color = Color.Green;
            ZAxis.Title.Text = "Z Axis";
            ZAxis.SetMinMax(-5, 100);
						//ZAxis.Increment = 23;

						//For Major Grid
						double start = -5;
						double end = 100;

						ZAxis.SetMinMax(start, end);
						ZAxis.MinimumOffset = 10;
						ZAxis.MaximumOffset = 10;

						//double zAxisIncrement = 23;
						//ZAxis.Labels.Items.Clear();
						//int labelItemNo = 0;
						//string zAxisFormat;
						//while (start <= end)
						//{
						//  zAxisFormat = "{0:#.#####}";//formatting for Z Axis - decimal places like 0.00000
						//  string zAxisValue = String.Format(zAxisFormat, start);
						//  ZAxis.Labels.Items.Add(start, zAxisValue);
						//  ZAxis.Labels.Items[labelItemNo].Font.Name = "Arial";
						//  ZAxis.Labels.Items[labelItemNo].Font.Size = 14;
						//  ZAxis.Labels.Items[labelItemNo].Font.Color = Color.Red;
						//  ZAxis.Labels.Items[labelItemNo].Font.Bold = false;
						//  start = start + zAxisIncrement;
						//  labelItemNo++;
						//}
        }
Best Regards,
| Narcís Calvet / Development & Support Steema Software Avinguda Montilivi 33, 17003 Girona, Catalonia Tel: 34 972 218 797 http://www.steema.com |
| |
| Instructions - How to post in this forum |
-
Narcís
- Site Admin
- Posts: 14730
- Joined: Mon Jun 09, 2003 4:00 am
- Location: Banyoles, Catalonia
- Contact:
Hi Raed,
I've been doing some more tests and I've found the same happens with an empty chart with the same data. I imagine the problem is that x values increments are not the same for each cell. I've added this issue (TF02013295) to the defect list to be enhanced for next releases.I see, no surface pen lines are drawn for x value = 470 (your Y axis). We will investigate the issue here and will get back to you when we have further news.
Best Regards,
| Narcís Calvet / Development & Support Steema Software Avinguda Montilivi 33, 17003 Girona, Catalonia Tel: 34 972 218 797 http://www.steema.com |
| |
| Instructions - How to post in this forum |
-
drillright40
- Newbie
- Posts: 57
- Joined: Mon Nov 19, 2007 12:00 am
-
Narcís
- Site Admin
- Posts: 14730
- Joined: Mon Jun 09, 2003 4:00 am
- Location: Banyoles, Catalonia
- Contact:
Hello Sanyog,
Do you mean that you can get grid line in the red-marked area to appear?
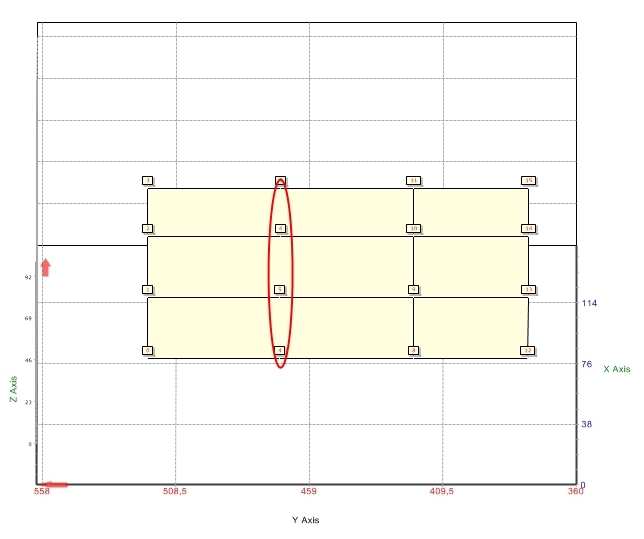
If so, thats issue TF02013295 I told you in my previous reply.
Thanks in advance.
Do you mean that you can get grid line in the red-marked area to appear?
If so, thats issue TF02013295 I told you in my previous reply.
Thanks in advance.
Best Regards,
| Narcís Calvet / Development & Support Steema Software Avinguda Montilivi 33, 17003 Girona, Catalonia Tel: 34 972 218 797 http://www.steema.com |
| |
| Instructions - How to post in this forum |
-
drillright40
- Newbie
- Posts: 57
- Joined: Mon Nov 19, 2007 12:00 am
-
Narcís
- Site Admin
- Posts: 14730
- Joined: Mon Jun 09, 2003 4:00 am
- Location: Banyoles, Catalonia
- Contact:
Hi Sanyog,
In that case, as a workaround, you can make surface's Pen not visible and manually draw the lines in TChart's AfterDraw event like this:
However, using this there's a little offset between the manually painted lines and surface's brush  .
.
In that case, as a workaround, you can make surface's Pen not visible and manually draw the lines in TChart's AfterDraw event like this:
Code: Select all
				void ChartDisplay_AfterDraw(object sender, Graphics3D g)
				{
					foreach (Steema.TeeChart.Styles.Series s in ChartDisplay.Series)
					{
						if (s is Steema.TeeChart.Styles.Surface)
						{
							Steema.TeeChart.Styles.Surface surfa = ((Steema.TeeChart.Styles.Surface)s);
							surfa.Pen.Visible = false;

							for (int i=0; i < surfa.Count; i++)
							{
								double tmpZVal = surfa.ZValues[i];

								if (tmpZVal < surfa.MaxZValue())
								{
									g.Line(surfa.CalcXPos(i), surfa.CalcYPos(i), surfa.CalcZPos(i),
												surfa.CalcXPos(i), surfa.CalcYPos(i), ChartDisplay.Axes.Depth.CalcPosValue(surfa.MaxZValue()));
								}

								double tmpXVal = surfa.XValues[i];

								if (tmpXVal < surfa.MaxXValue())
								{
									g.Line(surfa.CalcXPos(i), surfa.CalcYPos(i), surfa.CalcZPos(i),
												surfa.CalcXPosValue(surfa.MaxXValue()), surfa.CalcYPos(i), surfa.CalcZPos(i));
								}
							}

						}
					}
}Best Regards,
| Narcís Calvet / Development & Support Steema Software Avinguda Montilivi 33, 17003 Girona, Catalonia Tel: 34 972 218 797 http://www.steema.com |
| |
| Instructions - How to post in this forum |