how to show the merged X axes?

TeeChart for Microsoft Visual Studio .NET, Xamarin Studio (Android, iOS & Forms) & Monodevelop.
Post Reply
coldwind
Newbie
Newbie
Posts: 41
Joined: Tue Dec 27, 2022 12:00 am

how to show the merged X axes?

Post by coldwind » Mon Nov 06, 2023 4:11 pm

I hope to use the dataset with:

Code: Select all

[
	{year: 2021, wid: 'A',total: 10},
	{year: 2021, wid: 'B',total: 20},
	{year: 2021, wid: 'C',total: 20},
	{year: 2021, wid: 'D',total: 20},
	{year: 2022, wid: 'E',total: 10},
	{year: 2022, wid: 'F',total: 10},
	{year: 2022, wid: 'A',total: 20},
	{year: 2023, wid: 'S',total: 10},
	{year: 2023, wid: 'T',total: 20},
	{year: 2023, wid: 'H',total: 20},
	{year: 2023, wid: 'N',total: 10}
]

then the chart will show like:


Snipaste_2023-11-07_00-07-23.png
Snipaste_2023-11-07_00-07-23.png (9.66 KiB) Viewed 7256 times
the element 1-4 with the same year 2021,then i want to show once below the wid,
the element 5-8 with the same year 2022, then the year ‘2022 ’ show below the three wid value
...

when i has the same value,then show with sub axes below the origin x label

how need i to to?

Marc
Site Admin
Site Admin
Posts: 1217
Joined: Thu Oct 16, 2003 4:00 am
Location: Girona
Contact:

Re: how to show the merged X axes?

Post by Marc » Tue Nov 07, 2023 2:43 pm

Hello,

The points appear to be a continuous sequence. If you wish to fix the order then the easiest way might be to add an index to each point: 0,1,2..etc and use the year as a label, not as an X value.

Regards,
Marc Meumann
Steema Support

coldwind
Newbie
Newbie
Posts: 41
Joined: Tue Dec 27, 2022 12:00 am

Re: how to show the merged X axes?

Post by coldwind » Tue Nov 07, 2023 4:07 pm

Hi
My trouble is how to set the X label, but point order.

I can add the index to dataset .

I hope the point x label can show
2021, A
2021, B

but, the A,B maybe is long,then I hope samplify the x label, with merge same label, like A,B,C,D with 2021 year. then I can show one time with subplot .the chart X will show like:
Snipaste_2023-11-08_00-06-27.png
Snipaste_2023-11-08_00-06-27.png (3.08 KiB) Viewed 6987 times

Marc
Site Admin
Site Admin
Posts: 1217
Joined: Thu Oct 16, 2003 4:00 am
Location: Girona
Contact:

Re: how to show the merged X axes?

Post by Marc » Tue Nov 07, 2023 6:55 pm

Hello,

Perhaps I'm not understanding the question well so I'll answer different aspects in the way I see them.

An index on the data would give you the exact chart you want without the year labels:

ie.

Code: Select all

int[] idx = { 0, 1, 2, 3, 4, 5, 6, 7, 8, 9, 10 };
int[] year = { 2021, 2021, 2021, 2021, 2022, 2022, 2022, 2023, 2023, 2023, 2023 };
string[] label = { "A", "B", "C", "D", "E", "F", "A", "S", "T", "H", "N" };
double[] total = { 10, 20, 20, 20, 10, 10, 20, 10, 20, 20, 10 };

private void Form1_Load(object sender, EventArgs e)
{
    //note an index (idx here) is not required for this add overload as it is automatically added, but it 
    //helps to include it for clarity/understanding.
    for (int i = 0; i < 11; i++)
    {
        points1.Add(total[i], label[i]);

        //or
        //points1.Add(idx[i], total[i], label[i]);
    }

    tChart1.Axes.Left.SetMinMax(0, 50);
}
You can add the year to the label in this way, via the OnGetAxisLabel event:

Code: Select all

private void tChart1_GetAxisLabel(object sender, Steema.TeeChart.GetAxisLabelEventArgs e)
{
    if (sender == tChart1.Axes.Bottom)
    {
        if (e.ValueIndex != -1)
            e.LabelText = e.LabelText + "\n" + year[e.ValueIndex].ToString();
    }
}
If you only want the year once, at the first value of the year for example, then you could setup the OnGetAxisLabel event in this way:

Code: Select all

int lastYear = -1;

private void tChart1_GetAxisLabel(object sender, Steema.TeeChart.GetAxisLabelEventArgs e)
{
    if (sender == tChart1.Axes.Bottom)
    {
        if (e.ValueIndex != -1)
            if (lastYear != year[e.ValueIndex])
            {
                e.LabelText = e.LabelText + "\n      " + year[e.ValueIndex].ToString();
                lastYear = year[e.ValueIndex];
            }
    }
}
points_year.png
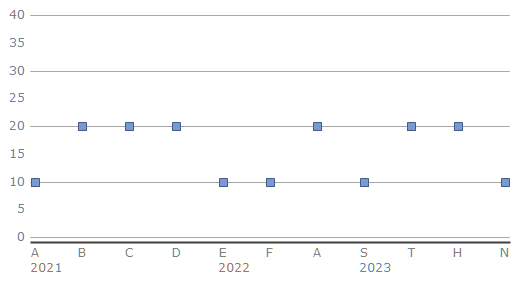
points_year.png (1.78 KiB) Viewed 6951 times
There are other options, including putting the year to the centre of each range, but that requires a little more work…

You could even plot the grouping symbol. Custom drawing is described here:
Custom drawing Tutorial

Regards,
Marc
Steema Support

coldwind
Newbie
Newbie
Posts: 41
Joined: Tue Dec 27, 2022 12:00 am

Re: how to show the merged X axes?

Post by coldwind » Wed Nov 08, 2023 3:34 pm

Thank you for help. It's close to what I want.

I want to custom the same year symbol, like the
Snipaste_2023-11-08_23-18-37.png
Snipaste_2023-11-08_23-18-37.png (4.39 KiB) Viewed 6917 times
or
Snipaste_2023-11-08_00-06-27.png
Snipaste_2023-11-08_00-06-27.png (3.08 KiB) Viewed 6917 times
.

Then I have try to use custom Drawing url,but failed.

how to draw the specified symbol above the year value
Could you help me please!

I hope the X look like
Snipaste_2023-11-08_23-31-17.png
Snipaste_2023-11-08_23-31-17.png (8.57 KiB) Viewed 6917 times
Through this result, I can directly see that A, B, C and D have the same year 2021.

Marc
Site Admin
Site Admin
Posts: 1217
Joined: Thu Oct 16, 2003 4:00 am
Location: Girona
Contact:

Re: how to show the merged X axes?

Post by Marc » Thu Nov 09, 2023 8:15 am

Hello,

Use the moveTo, lineTo Canvas methods to plot the lines you require.

Ypu can get the coordinates for each location by converting the axis location you wish for the group you decide.

ie.

Code: Select all

/*x location:*/ tChart1.Axes.Bottom.CalcXPosValue(yourPointvalue)
/*y location:*/ tChart1.Axes.Left.CalcYPosValue(tChart1.Axes.Left.Minimum)  
                     //gets bottom Axis location to which you can add the distance you require
/*or....*/
tChart1.Axes.Bottom.Position
Use the OnAfterDraw event for the custom drawing code.

Example of moveTo, LineTo from the tutorial I linked (this plots a diagonal line across the Chart:

Code: Select all

private void tChart1_AfterDraw(object sender, Steema.TeeChart.Drawing.Graphics3D g) { 
        Point s = new Point(tChart1.Axes.Left.Position, tChart1.Axes.Top.Position); 
        Point e = new Point(tChart1.Axes.Right.Position, tChart1.Axes.Bottom.Position); 
        g.MoveTo(s); 
        g.LineTo(e,0); 
} 
You can add the Year text in this way too, using the Canvas textOut method.

Example from tutorial:

Code: Select all

private void tChart1_AfterDraw(object sender, Steema.TeeChart.Drawing.Graphics3D g) { 
        string text = "My Text"; 
        Size s = new Size(150, 50); 
        Point p = new Point(g.ChartXCenter - (s.Width/2), g.ChartYCenter - (s.Height/2)); 
        Rectangle r = new Rectangle(p,s); 
        g.Pen.Color = Color.Blue; 
        g.Rectangle(r); 
 
        g.TextOut(Convert.ToInt32(g.ChartXCenter - (g.TextWidth(text)/2)), Convert.ToInt32(g.ChartYCenter - (g.TextHeight(text)/2)), text); 
}
If you can't access the custom drawing tutorial page I linked (I assume you can as you can access this forum page) there is an offline version here you can download:
https://www.steema.com/files/public/tee ... neDocs.zip

There's some work to write a calculation of the x and y locations of the points for each range, I'm not going to do that here as it requires more time than I have available right now; it's a question of deciding a system to group/set the point ranges and returning min-max points for the range for which to plot the lines. Once the rule is decided it can be applied generically for all cases.

Regards,
Marc Meumann
Steema Support

Marc
Site Admin
Site Admin
Posts: 1217
Joined: Thu Oct 16, 2003 4:00 am
Location: Girona
Contact:

Re: how to show the merged X axes?

Post by Marc » Thu Nov 09, 2023 8:43 am

An extra note, To make room for the extra content you wish to plot, increase the Chart's bottom margin.

For example:

Code: Select all

tChart1.Panel.MarginUnits = PanelMarginUnits.Pixels;
tChart1.Panel.MarginBottom = 80;

coldwind
Newbie
Newbie
Posts: 41
Joined: Tue Dec 27, 2022 12:00 am

Re: how to show the merged X axes?

Post by coldwind » Thu Nov 09, 2023 9:25 am

OK,I have draw the sample line.
But i have the next trouble is how to resize the chart canvas that can leave the space to draw my custom symbol.
Snipaste_2023-11-09_17-09-55.png
Snipaste_2023-11-09_17-09-55.png (25.37 KiB) Viewed 6875 times
I want to stretch vertical direction, and the chart Bottom can't change. like the red rectangle.
thus i have the spce to show my custom symbol.


And next question is, which function do i use to calc Y value?

I have use tChart1.Axes.Bottom.CalcYPosValue(0) eg.. but i can‘t see the point,I know it‘s exceed the canvas, so i want to know which one i should use to calculate the point Y value。
I think the fixed value like the 10 / 20 , to add the base value(tChart1.Axes.Bottom.Position) will cause the code ugly.

Marc
Site Admin
Site Admin
Posts: 1217
Joined: Thu Oct 16, 2003 4:00 am
Location: Girona
Contact:

Re: how to show the merged X axes?

Post by Marc » Thu Nov 09, 2023 10:01 am

Hello,

Re.
I want to stretch vertical direction
See my last answer about Margins.

Re.
I have use tChart1.Axes.Bottom.CalcYPosValue(0) eg.. but i can‘t see the point
A point is a combination of X and Y

ie. tChart1.Axes.Bottom.CalcXPosValue(0), tChart1.Axes.Bottom.CalcYPosValue(0)

Substitute that into the last example I sent you to test it.

Code: Select all

private void tChart1_AfterDraw(object sender, Steema.TeeChart.Drawing.Graphics3D g) { 
        Point s = new Point(tChart1.Axes.Left.Position, tChart1.Axes.Top.Position); 
        Point e = new Point(tChart1.Axes.Right.Position, tChart1.Axes.Bottom.Position); 
        g.MoveTo(s); 
        g.LineTo(e,0); 
} 
ie. test it, try for co-ordinates:

Code: Select all

Point s = new Point(Axes.Bottom.CalcXPosValue(0), Axes.Bottom.CalcYPosValue(12));
Point e = new Point(Axes.Bottom.CalcXPosValue(5), Axes.Bottom.CalcYPosValue(20)); 
if you wish to work using point index then use this example as a guide:

Code: Select all

private void tChart1_AfterDraw(object sender, Steema.TeeChart.Drawing.Graphics3D g)
{
    Point p5 = new Point(points1.CalcXPos(0), points1.CalcYPos(0));
    Point p15 = new Point(points1.CalcXPos(6), points1.CalcYPos(6));
    g.Pen.DashCap = System.Drawing.Drawing2D.DashCap.Triangle;
    g.Pen.EndCap = System.Drawing.Drawing2D.LineCap.DiamondAnchor;
    g.Pen.Style = System.Drawing.Drawing2D.DashStyle.DashDotDot;
    g.Pen.Transparency = 70;
    g.Pen.Width = 3;
    g.Pen.Color = Color.BlueViolet;
    g.MoveTo(p5);
    g.LineTo(p15, 0);
}
These examples are in the tutorial.

To apply to values below the axis, calculate the axis y and add fixed displacements of your choice.

Regards,
Marc Meumann
Steema Support

coldwind
Newbie
Newbie
Posts: 41
Joined: Tue Dec 27, 2022 12:00 am

Re: how to show the merged X axes?

Post by coldwind » Fri Nov 10, 2023 5:22 am

Ok, thank you for help.

When i use the margin, i faced the new problem.

The normal image is :
normal.png
normal.png (22.28 KiB) Viewed 6812 times

if the x label is long ,then i set the angle to 90 caues the result
覆盖.png
覆盖.png (24.48 KiB) Viewed 6812 times
i use the code:

tChart1.Axes.Bottom.Position + symbolBase to calc the custom symbol y position.

The x label is dynamical.
So i want to know how to get the standard calc function to get the point Y value then they can't overlap each other

Marc
Site Admin
Site Admin
Posts: 1217
Joined: Thu Oct 16, 2003 4:00 am
Location: Girona
Contact:

Re: how to show the merged X axes?

Post by Marc » Tue Nov 14, 2023 11:56 am

Hello,

Here's an example how to dynamically modify the location of output relative to Axis Label angle. This example outputs a small test text sample.

Code: Select all

  //declare var for max label width (length)
  double maxLabelWidth = 0;

  //then in Form_load or data refresh set:
  maxLabelWidth = tChart1.Axes.Bottom.MaxLabelsWidth();

  //will use radians for angle calcs
  public double ConvertToRadians(double angle)
  {
    return (Math.PI / 180) * angle;
  }

  //this example outputs test text in OnAfterDraw
  private void tChart1_AfterDraw(object sender, Steema.TeeChart.Drawing.Graphics3D g)
  {
    double hyp = maxLabelWidth;
    
    //some simple trig:
    //sin(@) = opp/hyp
    //yDisp = opp  therefore  = hyp * sin(@) 

    double angleRad = ConvertToRadians(tChart1.Axes.Bottom.Labels.Angle);
    double yDisp = tChart1.Axes.Bottom.Labels.Height; //minimum

    if ((tChart1.Axes.Bottom.Labels.Angle >= 0) && (tChart1.Axes.Bottom.Labels.Angle < 180))
      yDisp = yDisp + Math.Sin(angleRad) * maxLabelWidth;
    else
      yDisp = yDisp + Math.Sin(angleRad) * maxLabelWidth * -1;

    g.TextOut(10, (int)(tChart1.Axes.Bottom.Position + yDisp), "test label");

  }
Regards,
Marc Meumann
Steema Support

Post Reply