Contents page 
  Previous | Next 
 

Tutorial 6 - Working with Series


Contents

Series Types

Series Class structure
Choosing a Series Type
Adding data to a Series
Deleting data points from a Series
Adding Null points to a Series

Mixing Series Types on a Chart

Adding New Series
Choose Axes for a Series
Connecting Series
Changing Series order

Series Value list

Example using Values

Series Events

OnGetSeriesPointerStyle<
OnGetSeriesMark


Series Types

The TChartSeries component is the common ancestor for all Series types.

Series Class structure

As a little background on the structure of the TeeChart Type Library, here is an explanation of the Series classes and interfaces. The diagram below shows the relationship between TeeChart Series classes. All classes derive from the generic "Series" class and thus share "Series" methods. Several abstract Classes derive from Series (Custom3DSeries, CustomBarSeries and CircledSeries), these are highlighted in grey and their interfaces are not directly accessible for programming, their characteristics are inherited by their descendant Series types. All derived Series (in orange) are accessible in the TeeChart gallery for inclusion in your Chart. TeeChart Series, derived in this way, allow programmable access to the inherited methods via a common index structure (see example code later in this section).
 

TeeChart Pro's internal Series Class hierarchy

You can create and add new and differing Series types to the same Chart at design time.

//Add a series at runtime 
public void jButton2_actionPerformed(ActionEvent e) {

	Area area1 = new Area(tChart1.getChart());
        area1.fillSampleValues(4);
      
//Or 
//Area area1 = new Area();
//tChart1.getSeries().add(area1);
//area1.fillSampleValues(4);//tChart1.Series.Add(tmpAreaSeries); 
}

An example of mixing different series classes in the same Chart would be to add a Area (Series(0)), Bar (Series(1)) and Line (Series(2)) Series to a Chart at design time.
All access a common index structure, the Chart's Series list. To work with the Series may look something like the below:

//You could add the Series at runtime  
               Area area1 = new Area(tChart1.getChart().chart); 
               Bar bar1 = new Bar(tChart1.getChart().chart); 
               Line line1 = new Line(tChart1.getChart().chart); 
          
               //Use Series common properties  
               tChart1.getSeries(0).fillSampleValues(10); 
               tChart1.getSeries(1).fillSampleValues(10); 
               tChart1.getSeries(2).fillSampleValues(10); 
               tChart1.getSeries(1).getMarks().setVisible(false); 
               tChart1.getSeries(2).getMarks().setVisible(false); 
          
               //Modify Bar specific properties  
               bar1.setBarStyle(BarStyles.PYRAMID);
               bar1.getPen().setColor(Color.Yellow);
                         
               //Modify Line specific properties  
               line1.setStairs(true); //Set line to Stairs  
               line1.getLinePen().setColor(Color.Blue); //LineSeries bounding lines colour  
          
               //Modify Area specific properties  
               area1.getAreaBrush().setStyle(HatchStyle.CROSS); //Area fill pattern


Choosing a Series Type

Choosing a Series Type for a Chart will very much depend on your own requirements for the Chart. There are occasions, however, where the choice of Chart depends on which Series types support the number of input variables because of the high number of variables to plot. The following table shows the number of variables allowed by a sample of Series types.


Series Type

No. of variables

Datasource Properties


Basic


Line

2

XValues, YValues, XLabel

Fast Line

2

XValues, YValues, XLabel

Bar

2

XValues, YValues (called Bar), XLabel

HorizBar

2

XValues, YValues (called Bar), XLabel

Area

2

XValues, YValues, XLabel

Point

2

Xvalues, YValues, XLabel

Pie

1

PieValues, XLabel

Arrow

4

StartXValues, StartYValues, XLabel, EndXValues, EndYValues

Bubble

3

Xvalues, YValues, XLabel, RadiusValues

Gantt

3

StartValues, EndValues, AY (Y axis level), AXLabel (Label optionally shown on Y-axis or as mark)

Shape

4

X0 (Top), Y0 (Bottom), X1 (Left), Y1 (Right)

Extended


Bezier

2

XValues, YValues, XLabel

Candle

5

OpenValues, CloseValues, HighValues, LowValues, DateValues

Contour

3

XValues, YValues, XLabel, ZValues

Error Bar

3

XValues, YValues, XLabel, ErrorValues

Point3D

3

XValues, YValues, XLabel, ZValues

Polar

2

XValues, YValues, Labels (Polar has Angle and Radius)

Radar

2

XValues, YValues, Labels (Radar has Angle and Radius)

3D Surface

3

XValues, YValues, ZValues

Volume

2

XValues, YValues (VolumeValues), XLabel

Labelling can be used to extend the value of a 2 variable Series Type. See the example below that uses 3 instances of the Bar Series type in the same Chart.

Example

Uses Bar Series types

Product codeMonthQuantity produced
10Jan300
10Feb325
10Mar287
12Jan175
12Feb223
12Mar241
14Jan461
14Feb470
14Mar455

In its simplest form, the data produces the following Chart, grouping the information by month:

or (grouping by product):


We have added new values to the table above (Stock).

Product codeMonthQuantity producedStock level
10Jan300600
10Feb325715
10Mar287676
12Jan175245
12Feb223270
12Mar241315
14Jan461800
14Feb470755
14Mar455835

The values of stock are generally higher than those of monthly production so displaying them gives the following chart (2D this time). The Chart uses Line Series to differentiate Stocks.


Adding data to a Series

Most Series types (other than Functions Tutorial 7) use the Add and ADDXY methods for adding data. There are some exceptions, see the following table:


Series Type Add Series points Delete Series points
     
Standard Series types    
Line Series.Add
Series.AddXY
Series.AddNull
Series.AddNullXY
Series.Delete
Series.Clear
Horiz Line Series.Add
Series.AddXY
Series.AddNull
Series.AddNullXY
Series.Delete
Series.Clear
Fast Line Series.Add
Series.AddXY
Series.AddNull
Series.AddNullXY
Series.Delete
Series.Clear
Bar Series.Add
Series.AddXY
Series.AddNull
Series.AddNullXY
Series.Delete
Series.Clear
HorizBar Series.Add
Series.AddXY
Series.AddNull
Series.AddNullXY
Series.Delete
Series.Clear
Area Series.Add
Series.AddXY
Series.AddNull
Series.AddNullXY
Series.Delete
Series.Clear
Point Series.Add
Series.AddXY
Series.AddNull
Series.AddNullXY
Series.Delete
Series.Clear
Pie Series.Add
Series.AddNull
Series.Delete
Series.Clear
Arrow ArrowSeries.AddArrow
Series.AddNull
Series.AddNullXY
Series.Delete
Series.Clear
Bubble BubbleSeries.AddBubble
Series.AddNull
Series.AddNullXY
Series.Delete
Series.Clear
Gantt GanttSeries.AddGantt
GanttSeries.AddGanttColor
Series.Delete
Series.Clear
Shape ShapeSeries.X0,
ShapeSeries.Y0,
ShapeSeries.X1,
ShapeSeries.Y1
TChart.RemoveSeries
(Each Shape is a unique Series)

Colour

Colour may be manually added for a point when adding the point.

Example

tChart1.addSeries(new Bar());
tChart1.getSeries(0).add(50,"oranges", Color.Orange);

Alternatively, you can allow TeeChart to allocate a colour. TeeChart will choose one of up to 19 unique and as yet unused colours for each new Series, or for each new Series point if ColorEach is set to true.
Example

Random rnd = new Random();
    tChart1.getSeries(0).setColorEach(true);
     for(int i = 0; i < 19; ++i) {
         int higher = i + 65;
         tChart1.getSeries(0).add(rnd.nextInt(100));
   }
}


Deleting data points from a Series

Use Series.Delete to delete a point from a Series.

Example

tChart1.getSeries(0).delete(7);
//(8th point - Points index start at zero)

Series.Clear clears all points from a Series.


Adding Null points to a Series

See the table Adding data to a Series for a list of Series Types that support the AddNull method. As the name suggests, AddNull will add a Null point to the Series allowing you to define a label for the point but leaving a break in the Series at that point. In the case of a Line Series, the last point before the break will not join to the first point after the break. See Series.AddNull.

example

Line line = new Line();
line.addNull();


Mixing Series Types on a Chart

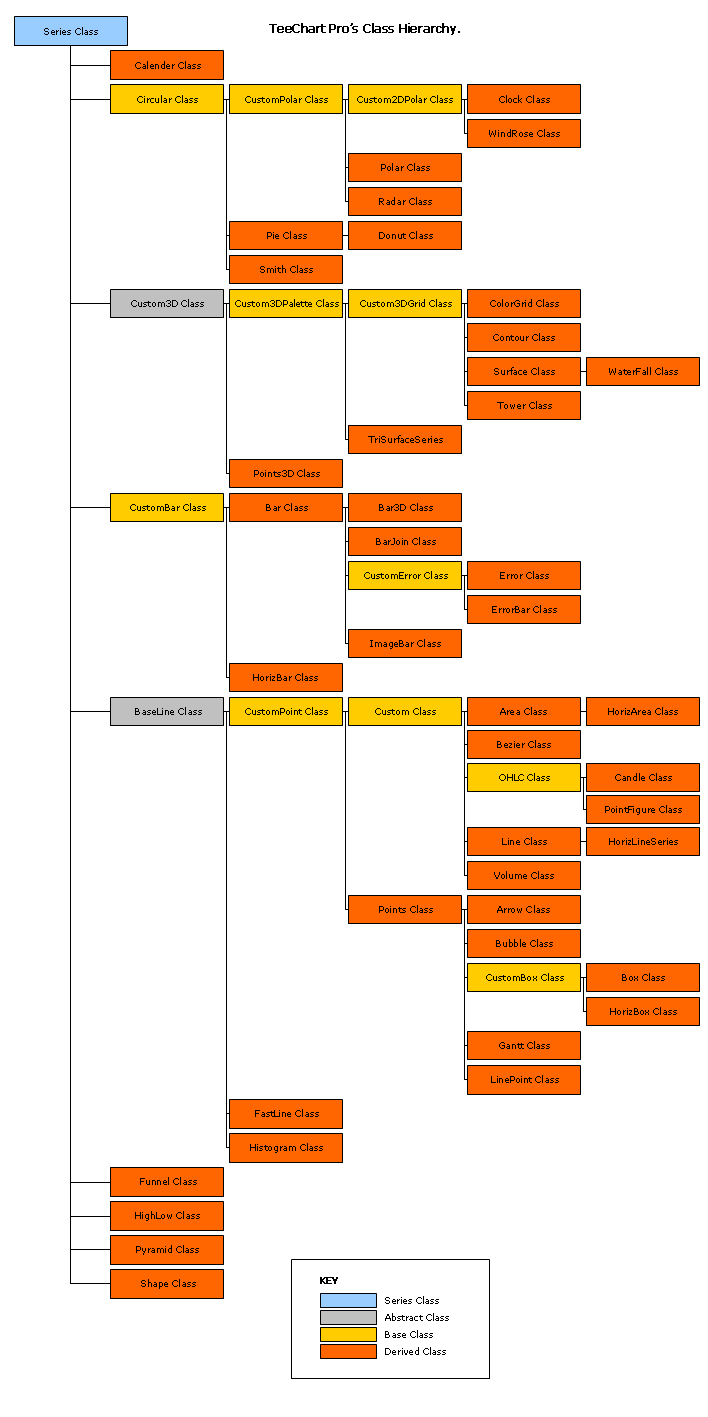
TeeChart Pro offers an empty Chart Canvas as a backdrop to data Series. That means that no Chart types are predefined. You define the Chart type you require as a mix of the Series Types that you wish to display. Due to the specialised nature of some Series types it is impractical to mix a few of the Series types together on a Chart. TeeChart helps you by greying out unsuitable Series types in the Chart Gallery when you arrive to add a new Series. There is no practical limit to the number of Series that you can put in one Chart.

Adding New Series

Add a Series using the Chart Editor (see Tutorial 1) or by code.

Example

public void jButton1_actionPerformed(ActionEvent e) {

    Bar bar1 = new Bar(tChart1.getChart().chart);
        bar1.fillSampleValues(10);
    } 
};

Choose Axes for a Series

Series added to the Chart will automatically take the Left and Bottom axes as their reference axes. You may change the reference axes in the Chart Editor by selecting the Series General page for the relevant Series. There are 4 axes available, Top, Left, Bottom and Right. By code, changing the axes will look like this:

bar1.setHorizontalAxis(HorizontalAxis.TOP);
bar1.setVerticalAxis(VerticalAxis.RIGHT);

More than 1 Series may be associated with each Axis. TeeChart will decide the best scale to fit the Series matched to the Axis but you may change Axis scales yourself (See the Axis Tutorial). Additional axes may be added, they will copy the scales associated with their counterparts from the first 4 axes (see the Tutorial section Additional axes).


Connecting Series

You may use a Series as the datasource for another Series. This can be done with the Chart Editor by setting the datasource for the 2nd Series. Go to the Series tab, Datasource page. Select 'Function' as the datasource type. Two Listboxes will appear, available Series and Selected Series. Select the Series you wish to use as the datasource for the present Series, then, in the Combobox above, entitled Function:, select Copy as the function type. Note that any Series, in this way, may be defined as a function of other Series and the Function Type may be any in the list available in the Function combobox. To do the same by code see below:

public void bFuncion_actionPerformed(ActionEvent e) {
Bar bar1 = new Bar();
bar1.fillSampleValues();
Line line1 = new Line();

com.steema.teechart.functions.Average average1 = new com.steema.teechart.functions.Average();
line1.setFunction(average1);
line1.setDataSource(bar1);
line1.checkDataSource(); 
}

See tutorial 7 - Working with Functions for more information about how to use TeeChart functions.


Changing Series order

Changing series order is very easy with the Chart Editor. Go to the front page of the Editor and highlight the Series that you wish to move. Use the arrow buttons on the right to move the Series up or down in the Series order. Series order will decide the relative display position of the Series in the Chart with respect to other Series. By code use the SeriesList property or the ExchangeSeries method.

Example
tChart1.exchangeSeries(0,1);  //Change Series(0) with Series(1) in the index order

*Note. After exchanging Series, the index for the Series will be changed. Thus the line of code above will perpetually interchange the 2 Series '0' and '1' if the code is rerun, as 0 becomes 1 and 1 becomes 0.

Setting a Series to 'Active:=False' will hide the Series from the Chart but maintain its data content intact.

Series Value list

TeeChart Series store their values in a Valuelist accessible and modifiable via the TChartValueList component.

Example using Values

This code modifies the value of a BarSeries Bar according to the user's mouseclick.

Example

upDatePoint(valueIndex,tChart1.getAxes().getLeft().calcPosPoint(e.Y));

Call the UpdatePoint Sub routine to modify the Bar's value:

private void upDatePoint(int Bar, double Y)
	{ 
		if(Bar < tChart1.getSeries(0).getCount())
		{
			tChart1.getSeries(0).getYValues().setValue(Bar,Y);
			tChart1.paint(tChart1.getGraphics());
		}
	}

Series events
 

The previous section introduces some use of Series events. This section shows some additional uses.
 

OnGetSeriesPointerStyle
For those Series that use the TChart Pointer, you may access and modify the Pointer using the OnGetSeriesPointer event:

Drawing an Uptriangle if the Point is higher than the last, DownTriangle if lower, etc.
 
 
if(e.ValueIndex > 0)  {
            if(line1.getYValues().getValue(e.ValueIndex) > 
               line1.getYValues().getValue(e.ValueIndex - 1))  {                
                e.Style = PointerStyles.TRIANGLE;
            }
            else if(line1.getYValues().getValue(e.ValueIndex) < 
                    line1.getYValues().getValue(e.ValueIndex - 1)) {
                e.Style = PointerStyles.DOWNTRIANGLE;
            }
            else {
                e.Style = PointerStyles.DIAMOND;
            }
        }
        else {
            e.Style = PointerStyles.DIAMOND;
        } 


OnGetSeriesMark
Use the OnGetSeriesMark event to modify the Mark contents at runtime. The following code varies the MarkText according to the value relative to the last;
TeeChart supports the dragging of Marks in cases of overlapping via the DragMarks Tool:


     if(e.ValueIndex > 0)  {
                 if(line1.getYValues().getValue(e.ValueIndex) >
			line1.getYValues().getValue(e.ValueIndex - 1)) {
                     e.MarkText = e.MarkText + " (Up)";
                 }
                 else if(line1.getYValues().getValue(e.ValueIndex) < 
			line1.getYValues().getValue(e.ValueIndex - 1)) { 
                    e.MarkText = e.MarkText + " (Down)";
                 }
                 else {
                     e.MarkText = e.MarkText + " (No Change)";
                 }
             }
         }


The Chart appearance resulting from the last 2 events is:


© 1996-2006 Steema Software SL. All rights reserved.