
Previous | Next
|
|
Contents page Previous | Next |
| Contents |
Function Types
Function characteristics |
A TeeChart Pro Function is a Series, that can be of almost any Series Type, to which an algebraic function is applied and for which the datasource is another Chart Series.
All Functions derive from the TTeeFunction, TTeeFunction Component and inherit TeeFunction's Period property.
TeeChart Pro includes the following list of predefined functions. Please see the TeeChart Editor Gallery and Helpfile for a full list of all Function Types:
|
Function Type |
No. of inputs |
Description |
| TAddTeeFunction, Add | Unlimited | Plots sum of inputs |
| TAverageTeeFunction, Average | Unlimited | The Average Function will calculate the average of every group of Period points |
| TBollingerFunction, Bollinger | 1 | The Bollinger Function uses simple or exponential moving average to constructs Bollinger Trading Bands |
| Copy | 1 | A direct copy of the input Series |
| TCurveFittingFunction, Curve Fitting | 1 | Draws fitted polynomial through data inputs using the TCustomFittingFunction.TypeFitting, TypeFitting formula |
| TDivideTeeFunction, Divide | Unlimited | The Divide Function plots inputs divided in descending order of inclusion |
| TExpAverageFunction, Exponential Average | 1 | Exponential average based on TExpAverageFunction.Weight, Weight |
| TExpMovAveFunction, Exponential Moving Average | 1 | Exponential moving average based on TExpAverageFunction.Weight, Weight |
| TExpTrendFunction, Exponential Trend | 1 | Draws best exponential trend line through points in input series |
| THighTeeFunction, High | Unlimited | The High Function plots high point of inputs |
| TLowTeeFunction, Low | Unlimited | The Low Function plots low point of inputs |
| TMACDFunction, MACD | 1 | Moving Average Convergence Divergence |
| TMomentumFunction, Momentum | 1 | Each Y value is the current point's Y value less the last Period point's Y value |
| TMomentumDivFunction, Momentum Division | 1 | Each Y values is the current point's Y value divided by the last Period point's YValue, expressed in percents |
| TMovingAverageFunction, Moving Average | 1 | The Moving Average Function will calculate the simple or weighted average of every group of Period points |
| TMultiplyTeeFunction, Multiply | Unlimited | The Multiply Function plots value of inputs multiplied |
| TRMSFunction, Root Mean Square | Unlimited | The Root Mean Square Function plots RMS value of inputs |
| TRSIFunction, Relative Strength Index | 1 | RSI Function calculates a percent value based on financial data. Depending on TRSISyle type different formula will be used to calculate RSI value |
| TSTDDeviationFunction, Standard Deviation | 1 | Maps the Standard Deviation (or Complete Standard Deviation) of every group of Period points |
| TStochasticFunction, Stochastic | 1 | |
| TSubtractTeeFunction, Subtract | Unlimited | Plots value of inputs subtracted in descending order of inclusion |
| TTrendFunction, Trend | 1 | Draws best trend line through points of input Series |
Several Function types support only one input Series. However it is possible to chain link Functions, thus, for example, taking the average of several Series in your Chart to create an Average Function Series, then identify the Trend of the average by using the Average Function as the input to the Trend Function.
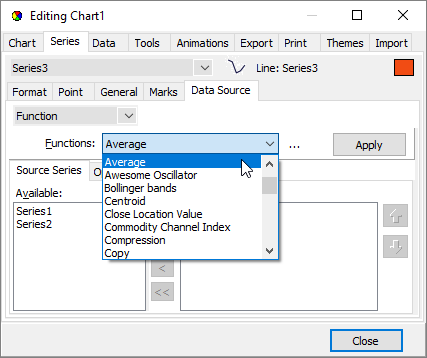
With the Chart Editor, on the First Chart page, select the Add button as if to add a new Series to the Chart. In the TeeChart Gallery choose the Functions tab to select the Function you require. Each Function is presented as a Line Series, you may change the Series Type associated with the Function later by choosing the Change button on the first Chart Page. Function definitions are easily changed afterwards on the Datasource page of the Function Series. Here, just as easily, you may change the definition of a normal Series that you have added to the Chart to that of a Function (Function is really a definition of datasource, not a definition of Series Type).
The image below shows the Datasource page when editing a Function. The Line Series (Name "Series2", Title "Average") is defined. The left listbox at the bottom of the Datasource page shows other Series in the Chart available for input (here "Series1").
Assuming we start with a completely empty Chart here are the steps in code to build a simple Series-Function related Chart.
procedure TForm1.BitBtn5Click(Sender: TObject);
var tmpBarSeries1,
    tmpBarSeries2 : TBarSeries;
    tmpLineSeries : TLineSeries;
begin
  //Add 2 data Series

  tmpBarSeries1:=TBarSeries.Create(Self);
  tmpBarSeries2:=TBarSeries.Create(Self);

  AddSeries(tmpBarSeries1);
  AddSeries(tmpBarSeries2);

  //Populate them with data (here random)
  tmpBarSeries1.FillSampleValues(10);
  tmpBarSeries2.FillSampleValues(10);

  //Add a series to be used for an Average Function
  tmpLineSeries:=TLineSeries.Create(Self);
  AddSeries(tmpLineSeries);

  //Define the Function Type for the new Series
  tmpLineSeries.SetFunction(TAverageTeeFunction.Create(Self));

  //Define the Datasource for the new Function Series
  //Datasource accepts the Series titles of the other 2 Series
  tmpLineSeries.DataSources.Clear;
  tmpLineSeries.DataSources.Add( tmpBarSeries1 );
  tmpLineSeries.DataSources.Add( tmpBarSeries2 );

  //    *Note - When populating your input Series manually you will need to
  //    use the Checkdatasource method
  //    - See the section entitled 'Defining a Datasource'
  //Change the Period of the Function so that it groups averages
  //every 2 Points

  tmpLineSeries.FunctionType.Period := 2;
end;
We can add another Function to tell us something about the previous Function
procedure TForm1.BitBtn6Click(Sender: TObject);
var tmpHighLine : TLineSeries;
begin
   //Add another Series to be used for a 2nd Function

   tmpHighLine:=TLineSeries.Create(Self);
   AddSeries(tmpHighLine);

   //Define the Function Type for the new Series

   tmpHighLine.SetFunction(THighTeeFunction.Create(self));

   //Define the Datasource for the new Function Series
   //Use the existing Function (tmpLineSeries) as input
   //You should declare tmpLineSeries globally to the module
   //if you wish to use it between procedures

   tmpHighLine.DataSource := tmpLineSeries;

   //Leave the Period at default 0 (No Period set) to draw
   //A line at Highest of all points of the Average Function
end;
The examples in the previous section highlight the use of Datasource for poulating a Function by code. Series use Datasource for defining the input for a Function or to define a Series TDataset datasource (see the Tutorial about accessing databases).
Using the Chart Editor, after adding a Function, the Function Series' Datasource page will show a list of available series for inclusion in the function definition. Here you may change the Function Type you wish to apply to the Series and select Series from the Left listBox "Available" and add them to the right Listbox,"Selected".
Datasource by code uses the TChartSeries.Datasource, Series.Datasource property.
Example
Suppose we have 2 data Series in a Chart. We Use the Chart Editor to add a Function composed of the average of the 2 Series:
We add points to the 2 Series:
var t : Integer;

For t := 0 To 10 do
begin
  Series1.Add(2 * t);
  Series2.Add(3 * t);
end;
Notice that the Function doesn't display. You need to use the TChartSeries.CheckDatasource, Series.CheckDatasource method to read in values for the Function.
Series3.CheckDataSource; //Read in data for Function
Function definition may be changed at runtime using the Setfunction method to allocate a new Function to the Series.
Series3.Setfunction(TMovingAverageFunction.Create(self));
with the above line of code, Setfunction changes the Function for Series3 to a Moving Average.
TTeeFunction.Period, Period is an important property for working with Functions as the Period defines the range of points across which a Function is cyclically applied.
Example
We have 6 data points (eg. bars of a Bar Series) with values:
3, 8, 6, 2, 9 and 12
We define a Function Series with Period 0 (default) the average drawn is:
6.667
With Period set to 2 we get 3 values of average as output from the function:
5.5, 4 and 10.5
These values will plot centrally in their period range, ie. The 1st value between bars 1 and 2 of the input series, 2nd value between bars 3 and 4, etc..
You may define Period by selecting the function in the Chart Editor or you may modify Period at runtime using FunctionType.
Eg. Where Series 2 is the function series:
Series2.FunctionType.Period:=2;
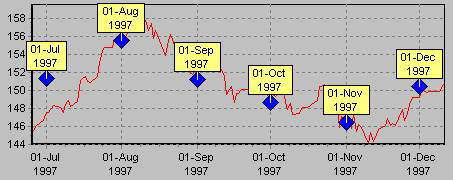
Below are 2 Charts that highlight the effect of an applied Period
 |  |
When the function "Period" is greater than zero (so it calculates by groups of points),the function results are added to the series by default at the "center" position of the Function Period. The PeriodAlign property controls "where" to place function calculations inside the full period space.
TeeFunction1.PeriodAlign := paCenter ; { <-- by default it is centered }
The "paFirst" and "paLast" constants will plot calculations at the start and end "X" coordinates of each "Period". Every blue point shows the "average" using all points between the first day and the last day of the month.
As you can see from the picture below, the "average" is plotted at the end of the month.
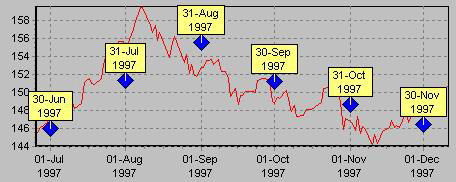
In this case the "average" is plotted at the beginning of the month.
Creating a new Function component is simply creating a new component derived
from TTeeFunction (it also can be derived from an existing function ).
1) Function TTeeFunction.Calculate(SourceSeries:TChartSeries; First,Last:Longint):Double;
2) Function TTeeFunction.CalculateMany(SourceSeriesList:TList; ValueIndex:Longint):Double;
The Calculate method is used to calculate function result if only one series is datasource. CalculateMany is used to calculate function result if multiple series can be datasource.
Example : Creating new TMyFunction
Let’s decide we need TMyFunction to return the "sum of squares".
type
 TMyFunction = class( TTeeFunction )
 end;
This function can have only one datasource or multiple datasources, so we'll override the Calculate and CalculateMany methods.
First, we'll override TMyFunction "Calculate" method to do a very simple thing. The "Calculate" method looks like:
Function TMyFunction.Calculate(SourceSeries:TChartSeries; First,Last:Integer):Double;
Var StartPoint, EndPoint, t : Integer;
begin
  StartPoint:=0;

  EndPoint:=SourceSeries.Count-1;

  if First <> -1 then StartPoint:=First;

  if Last <> -1 then EndPoint:=Last;

  Result:=0;

  for t:=StartPoint to EndPoint do
      Result:= Result + Sqr(SourceSeries.MandatoryValueList[t]);
end;
The StartPoint and EndPoint variables are used to "loop" all SourceSeries points to calculate the sum of squares.
The "MandatoryValueList" property is used instead of "YValues" property just to make this function to work with Series types like HorizBarSeries where "XValues" holds the point values and not "YValues".
The "Calculate" method is used when the Series has only one Series as DataSource. When Series have more than one Series as datasources, the "CalculateMany" method is called.
Let's override TMyFunction "CalculateMany" to allow TMyFunction to work with Series which have more than one Series as datasources. Programmatically, Series can be added as datasources of other Series.
Function TMyFunction.CalculateMany(SourceSeriesList:TList;
                                   ValueIndex: Integer):Double;
var t : Integer;
begin
  Result:=0 ;

  for t:= 0 to SourceSeriesList.Count -1 do
      Result := Result + sqr(TChartSeries(SourceSeriesList[t]).MandatoryValueList[ValueIndex]);
end;
"CalculateMany" will get called once for each point in the source Series,
starting from zero and ending with the minimum point count of all datasources.
It is very important to understand the difference between Calculate and CalculateMany. "Calculate" is called when there only one datasource and it’s called only once. "CalculateMany" is called several times (one for each point) when there are more than one Series as datasources.
 |
 |