
Previous | Next
|
|
Contents page Previous | Next |
The TChartSeries component is the common ancestor for all Series types.
As a little background on the structure of the TeeChart Component Library, here follows an explanation of the Series Components and their structure. The diagram below shows the relationship between TeeChart Series classes. All classes derive from the generic "TChartSeries" class and thus share "Series" properties and methods. Several other generic Classes derive from Series (CustomSeries, CustomBarSeries and CircledSeries), these are highlighted in green and their components are not directly accessible for programming, their characteristics are inherited by their descendant Series types. All derived Series (in red) are accessible in the TeeChart gallery for inclusion in your Chart. TeeChart Series, derived in this way, allow programmable access via a common index structure (collection).
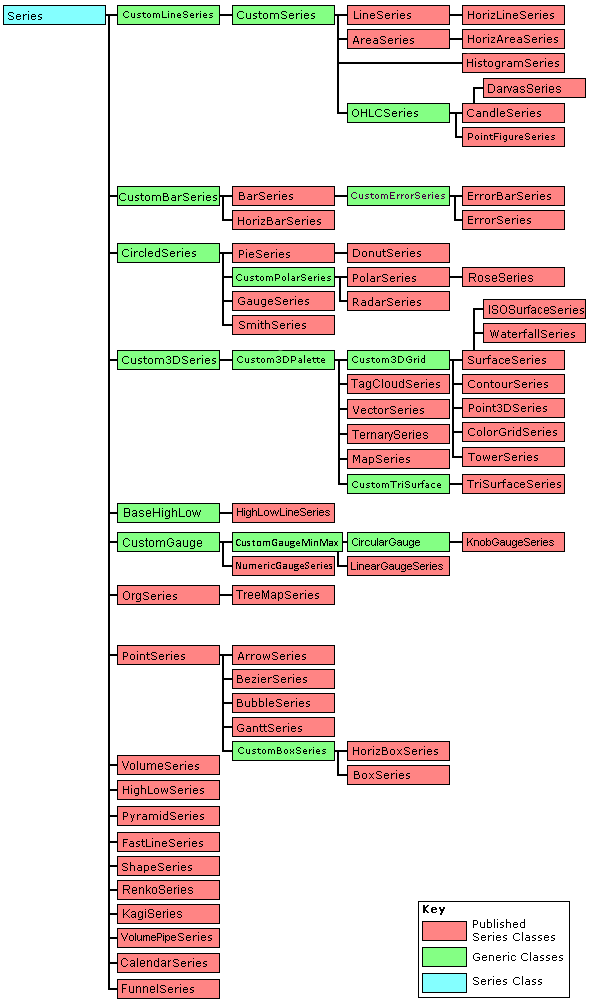 | TeeChart Pro's internal Series Class hierarchy |
It's easier to use the TChart Editor to add Series at design time but you can also create and add new and differing Series types to the same Chart at runtime.
//You could add the Series at runtime
procedure TForm1.Button2Click(Sender: TObject);
var tmpAreaSeries:TAreaSeries;
begin
  tmpAreaSeries:=TAreaSeries.Create(self);

  With tmpAreaSeries do
  begin
    ParentChart:=Chart1;
    FillSampleValues(10);
  end;
end;
All AreaSeries properties and methods are available for the new Series as for any Series created at design time.
Choosing a Series Type for a Chart will very much depend on your own requirements for the Chart. There are occasions, however, where the choice of Chart depends on which Series types support the number of input variables because of the high number of variables to plot. The following table shows the number of variables allowed by some different Series types. For the brevity of this tutorial we haven't included all the possible Series types offered with TeeChart.
|
Series Type |
No. of variables |
Datasource Properties |
|
Standard |
||
|
TLineSeries, Line |
2 |
XValues, YValues, XLabel |
|
TFastLineSeries: Fast Line |
2 |
XValues, YValues, XLabel |
|
TBarSeries: Bar |
2 |
XValues, YValues (called Bar), XLabel |
|
THorizBarSeries: HorizBar |
2 |
XValues, YValues (called Bar), XLabel |
|
TAreaSeries: Area |
2 |
XValues, YValues, XLabel |
|
TPointSeries: Point |
2 |
Xvalues, YValues, XLabel |
|
TPieSeries: Pie |
1 |
PieValues, XLabel |
|
THorizLineSeries, Horiz. Line |
2 |
XValues, YValues, YLabel |
|
THorizAreaSeries, Horiz. Area |
2 |
XValues, YValues, XLabel |
|
TChartShape, Shape |
4 |
X0 (Top), Y0 (Bottom), X1 (Left), Y1 (Right) |
|
TBubbleSeries, Bubble |
3 |
Xvalues, YValues, XLabel, RadiusValues |
|
TGanttSeries, Gantt |
3 |
StartValues, EndValues, AY (Y axis level), AXLabel (Label optionally shown on Y-axis or as mark) |
|
Extended |
||
|
TArrowSeries, Arrow |
4 |
StartXValues, StartYValues, XLabel, EndXValues, EndYValues |
|
TPolarSeries, Polar |
2 |
XValues, YValues, Labels (Polar has Angle and Radius) |
|
TRadarSeries, Radar |
2 |
XValues, YValues, Labels (Radar has Angle and Radius) |
|
TBezierSeries, Bezier |
2 |
XValues, YValues, XLabel |
|
TDonutSeries, Donut |
2 |
Angle, YValue, Labels |
|
TSmithSeries, Smith |
2 |
Resistance, Reactance, Labels |
|
TPyramidSeries, Pyramid |
3 |
XValues, YValues, XLabel, ErrorValues |
|
Financial |
||
|
TCandleSeries, Candle |
5 |
OpenValues, CloseValues, HighValues, LowValues, DateValues |
|
TPointFigureSeries, Point & Figure |
5 |
OpenValues, CloseValues, HighValues, LowValues, DateValues |
|
TVoumeSeries, Volume |
2 |
XValues, YValues (VolumeValues), XLabel |
|
Stats |
||
|
THistogramSeries, Histogram |
2 |
Xvalues, YValues, XLabel |
|
TErrorBarSeries, Error Bar |
3 |
XValues, YValues, XLabel, StdErrorValues |
|
TErrorSeries, Error |
3 |
XValues, YValues, XLabel, StdErrorValues |
|
THighLowSeries, High-Low |
3 |
XValues, YValues, XLabel, LowValues |
|
TBoxPlotSeries, Box Plot |
3 |
XValues, SamplesValues, Label |
|
THorizBoxPlotSeries, Horizontal Box Plot |
3 |
XValues, SamplesValues, Label |
|
TFunnelSeries, Funnel |
3 |
XValues, QuoteValues, OpportunityValues, XLabel |
|
3D |
||
|
TSurfaceSeries, Surface |
3 |
Xvalues, YValues, ZValues |
|
TContourSeries, Contour |
3 |
XValues, YValues, ZValues, XLabel |
|
TWaterfallSeries, Waterfall |
3 |
Xvalues, YValues, ZValues |
|
TColorGridSeries, ColorGrid |
3 |
XValues, YValues, ZValues |
|
TTowerSeries, Tower |
3 |
XValues, YValues, XLabel, ZValues |
|
TPoint3DSeries, Point3D |
3 |
XValues, YValues, XLabel, ZValues |
|
TTriangleSurfaceSeries, Triangle Surf. |
3 |
Xvalues, YValues, ZValues |
|
Other |
||
|
TClockSeries, Clock |
2 |
Angle, YValues, Labels |
|
TLinePointSeries, Line Point |
2 |
XValues, YValues, XLabel |
|
TBarJoinSeries, Bar Join |
2 |
Xvalues, YValues, XLabel |
|
TBar3DSeries, Bar3D |
3 |
XValues, YValues, YStartPoint, XLabel |
|
TWindRoseSeries, WindRose |
2 |
Angle, YValues, Labels |
|
TCalendarSeries, Calendar |
2 |
XValues, YValues, Labels |
|
Gauges |
||
|
TGaugeSeries, Gauge |
1 |
Value |
Labelling can be used to extend the value of a 2 variable Series Type. See the example below that uses 3 instances of the Bar Series type in the same Chart.
Example
Uses Bar Series types
| Product code | Month | Quantity produced |
| 10 | Jan | 300 |
| 10 | Feb | 325 |
| 10 | Mar | 287 |
| 12 | Jan | 175 |
| 12 | Feb | 223 |
| 12 | Mar | 241 |
| 14 | Jan | 461 |
| 14 | Feb | 470 |
| 14 | Mar | 455 |
In its simplest form, the data produces the following Chart, grouping the information by month:

or (grouping by product):

We have added new values to the table above (Stock).
| Product code | Month | Quantity produced | Stock level |
| 10 | Jan | 300 | 600 |
| 10 | Feb | 325 | 715 |
| 10 | Mar | 287 | 676 |
| 12 | Jan | 175 | 245 |
| 12 | Feb | 223 | 270 |
| 12 | Mar | 241 | 315 |
| 14 | Jan | 461 | 800 |
| 14 | Feb | 470 | 755 |
| 14 | Mar | 455 | 835 |
The values of stock are generally higher than those of monthly production so displaying them gives the following chart (2D this time). The Chart uses Line Series to differentiate Stocks.

Most Series types (other than ODBC datasources Tutorial 8 and Functions Tutorial 7) use the Add and ADDXY methods for adding data. There are some exceptions, see the following table for examples of how they can differ:
| Series Type | Add Series points | Delete Series points |
| Standard Series types | ||
| TLineSeries, Line |
TChartSeries.Add, Series.Add TChartSeries.AddXY, Series.AddXY TChartSeries.AddNull, Series.AddNull TChartSeries.AddNullXY, Series.AddNullXY |
TChartSeries.Delete, Series.Delete TChartSeries.Clear, Series.Clear |
| THorizLineSeries, Horiz Line |
TChartSeries.Add, Series.Add TChartSeries.AddXY, Series.AddXY TChartSeries.AddNull, Series.AddNull TChartSeries.AddNullXY, Series.AddNullXY |
TChartSeries.Delete, Series.Delete TChartSeries.Clear, Series.Clear |
| TFastLineSeries, Fast Line |
TChartSeries.Add, Series.Add TChartSeries.AddXY, Series.AddXY TChartSeries.AddNull, Series.AddNull TChartSeries.AddNullXY, Series.AddNullXY |
TChartSeries.Delete, Series.Delete TChartSeries.Clear, Series.Clear |
| TBarSeries, Bar |
TChartSeries.Add, Series.Add TChartSeries.AddXY, Series.AddXY TChartSeries.AddNull, Series.AddNull TChartSeries.AddNullXY, Series.AddNullXY |
TChartSeries.Delete, Series.Delete TChartSeries.Clear, Series.Clear |
| THorizBarSeries, HorizBar |
TChartSeries.Add, Series.Add TChartSeries.AddXY, Series.AddXY TChartSeries.AddNull, Series.AddNull TChartSeries.AddNullXY, Series.AddNullXY |
TChartSeries.Delete, Series.Delete TChartSeries.Clear, Series.Clear |
| TAreaSeries, Area |
TChartSeries.Add, Series.Add TChartSeries.AddXY, Series.AddXY TChartSeries.AddNull, Series.AddNull TChartSeries.AddNullXY, Series.AddNullXY |
TChartSeries.Delete, Series.Delete TChartSeries.Clear, Series.Clear |
| TPointSeries, Point |
TChartSeries.Add, Series.Add TChartSeries.AddXY, Series.AddXY TChartSeries.AddNull, Series.AddNull TChartSeries.AddNullXY, Series.AddNullXY |
TChartSeries.Delete, Series.Delete TChartSeries.Clear, Series.Clear |
| TPieSeries, Pie |
TChartSeries.Add, Series.Add TChartSeries.AddNull, Series.AddNull |
TChartSeries.Delete, Series.Delete TChartSeries.Clear, Series.Clear |
| TArrowSeries, Arrow |
TArrowSeries.AddArrow, ArrowSeries.AddArrow TChartSeries.AddNull, Series.AddNull TChartSeries.AddNullXY, Series.AddNullXY |
TChartSeries.Delete, Series.Delete TChartSeries.Clear, Series.Clear |
| TBubbleSeries, Bubble |
TBubbleSeries.AddBubble, BubbleSeries.AddBubble TChartSeries.AddNull, Series.AddNull TChartSeries.AddNullXY, Series.AddNullXY |
TChartSeries.Delete, Series.Delete TChartSeries.Clear, Series.Clear |
| TGanttSeries, Gantt |
TGanttSeries.AddGantt, GanttSeries.AddGantt TGanttSeries.AddGanttColor, GanttSeries.AddGanttColor |
TChartSeries.Delete, Series.Delete TChartSeries.Clear, Series.Clear |
| TChartShape, Shape |
TChartShape.X0, ShapeSeries.X0, ShapeSeries.Y0, ShapeSeries.X1, ShapeSeries.Y1 |
TCustomAxisPanel.RemoveSeries, TChart.RemoveSeries (TCustomAxisPanel) (Each Shape is a unique Series) |
Colour
Colour may be manually added for a point when adding the point
Example
Series1.Add(46, 'My first value', clYellow);
Alternatively use the TeeChart constant clTeeColor, telling TeeChart to allocate a colour. TeeChart will choose one of up to 16 unique and as yet unused colours for each new Series.
Example
Series1.Add(46, 'My first value', clTeeColor);
Use TChartSeries.Delete, Series.Delete to delete a point from a Series.
Example
Series1.Delete(7); //(8th point - Points index start at zero)
TChartSeries.Clear, Series.Clear clears all points from a Series.
See the table Adding data to a Series for a list of Series Types that support the AddNull method. As the name suggests, AddNull will add a Null point to the Series allowing you to define a label for the point but leaving a break in the Series at that point. In the case of a Line Series, the last point before the break will not join to the first point after the break. See TChartSeries.AddNull, Series.AddNull.
example
Series1.AddNull('my null value');
TeeChart Pro offers an empty Chart Canvas as a backdrop to data Series. That means that no Chart types are predefined. You define the Chart type you require as a mix of the Series Types that you wish to display. Due to the specialised nature of some Series types it is impractical to mix a few of the Series types together on a Chart. TeeChart helps you by greying out unsuitable Series types in the Chart Gallery when you come to add a new Series. There is no practical limit to the number of Series that you can put in one Chart.
Add a Series using the Chart Editor (see Tutorial 1) or by code.
Example
procedure TForm1.Button2Click(Sender: TObject);
var tmpLineSeries:TLineSeries;
begin
  tmpLineSeries:=TLineSeries.Create(self);
  Chart1.AddSeries(tmpLineSeries);
  tmpLineSeries.FillSampleValues(10);
end;
Series added to the Chart will automatically take the Left and Bottom axes as their reference axes. You may change the reference axes in the Chart Editor by selecting the Series General page for the relevant Series. There are 4 axes available, Top, Left, Bottom and Right. By code, changing the axes will look like this:
With Series1 do
begin
 HorizAxis := aTopAxis;
 VertAxis := aRightAxis;
end;
More than 1 Series may be associated with each Axis. TeeChart will decide the best scale to fit the Series matched to the Axis but you may change Axis scales yourself (See the Axis Tutorial). Additional axes may be added, they will copy the scales associated with their counterparts from the first 4 axes (see the Tutorial section Additional axes).
You may use a Series as the datasource for another Series. This can be done with the Chart Editor by setting the datasource for the 2nd Series. Go to the Series tab, Datasource page. Select 'Function' as the datasource type. Two Listboxes will appear, available Series and Selected Series. Select the Series you wish to use as the datasource for the present Series, then, in the Combobox above, entitled Function:, select Copy as the function type. Note that any Series, in this way, may be defined as a function of other Series and the Function Type may be any in the list available in the Function combobox. To do the same by code see below:
procedure TForm1.BitBtn2Click(Sender: TObject);
begin
 With Series2 do
 begin
   Datasource:=Series1;
   SetFunction(TAverageTeeFunction.Create(Self));
   FunctionType.Period := 4;
   CheckDatasource;
 end
end;
See tutorial 7 - Working with Functions for more information about how to use TeeChart functions.
Changing series order is very easy with the Chart Editor. Go to the front page of the Editor and highlight the Series that you wish to move. Use the arrow buttons on the right to move the Series up or down in the Series order. Series order will decide the relative display position of the Series in the Chart with respect to other Series. By code use the TCustomAxisPanel.SeriesList, SeriesList property or the TCustomAxisPanel.ExchangeSeries, ExchangeSeries method.
ExampleChart1.ExchangeSeries(0, 1); //Change Series(0) with Series(1) in the index order
*Note. After exchanging Series, the index for the Series will be changed. Thus the line of code above will perpetually interchange the 2 Series '0' and '1' if the code is rerun, as 0 becomes 1 and 1 becomes 0.
Setting a Series to 'Active:=False' will hide the Series from the Chart but maintain its data content intact.
TeeChart Series store their values in a Valuelist accessible and modifiable via the TChartValuelist, TChartValueList component.
You may access any value in the list:
Example
ShowMessage(FloatToStr(Series1.XValues[3]));
//Displays value of 4th point (index starts at 0) in Series1
Values accessed in this way may be used to set trap conditions on Series data:
 With Series1 do
 begin
   For t := 0 To Count - 1 do
   begin
     If YValues[t] > 9 Then
       ShowMessage('Value: ' + FloatToStr(XValues[t])
       + ', ' + FloatToStr(YValues[t]) + ' exceeds limit');
   end;
 end;
The same value may be obtained via the point ValueIndex used by some Series methods and several Chart events.
Example
procedure TForm1.Series1Click(Sender: TChartSeries; ValueIndex: Integer;
  Button: TMouseButton; Shift: TShiftState; X, Y: Integer);
begin
  Showmessage('ValueIndex is: ' + IntToStr(ValueIndex));
  Showmessage('Point''s Y value is: ' + FloatToStr(Sender.YValues.Value[ValueIndex]));
  Chart1.CancelMouse:=True;  //Use CancelMouse to prevent Zoom event activating
end;
Note
When clicking on 3D Series, only clicks on the front plane will be recognised as
Series clicks.
This code modifies the value of a BarSeries Bar according to the user's mouseclick.
Example
//Use the OnClickSeries or OnClickBackground event to determine where the user has clicked.

procedure TForm1.Chart1ClickBackground(Sender: TCustomChart;
  Button: TMouseButton; Shift: TShiftState; X, Y: Integer);
begin
If (Int(Chart1.Axes.Bottom.CalcPosPoint(X)) > -1) Then
  Case Ord(Button) of
  0 : UpdatePoint(Chart1.Axes.Bottom.CalcPosPoint(X), Chart1.Axes.Left.CalcPosPoint(Y));
  end;
end;

procedure TForm1.Series1Click(Sender: TChartSeries; ValueIndex: Integer;
  Button: TMouseButton; Shift: TShiftState; X, Y: Integer);
begin
  UpdatePoint(ValueIndex, Chart1.Axes.Left.CalcPosPoint(Y));
  Chart1.CancelMouse:=True;  //Use CancelMouse to prevent Zoom event activating
end;
In both cases call the UpdatePoint Sub routine to modify the Bar's value:
Procedure TForm1.UpdatePoint(Bar, Y : Double);
begin
  If Round(Bar) < Series1.Count Then
  begin
    Series1.YValues[Round(Bar)] := Int(Y);
    Chart1.refresh;
  end;
end;
 |
 |