Page 1 of 1
Timeline charts
Posted: Mon Aug 20, 2007 2:20 pm
by 13045819
Would LOVE to have a timeline chart something like the following:
http://www.smartdraw.com/examples/previ ... y_Timeline
Ideally, you would be able to include it on the same time axis as other charts and each of the annotations would be clickable links. Would be nice to be able to associate data with the current Gantt charts as well. That way, tasks could be linked to their detail.
-LC
Posted: Mon Aug 20, 2007 2:29 pm
by narcis
Hi LC,
Thanks for your suggestion. It's an interesting idea and I've added it to our wish-list to be considered for inclusion in future releases.
Re: Timeline charts
Posted: Wed Jun 25, 2014 3:36 pm
by 16468279
Hello,
is it possible now to create a timeline?
Re: Timeline charts
Posted: Thu Jun 26, 2014 8:30 am
by yeray
Hello,
I'm afraid there isn't a series to directly draw this, but it wouldn't be difficult to use the existing series to achieve a very similar result. Ie:
Code: Select all
uses CandleCh, DateUtils;

procedure TForm1.FormCreate(Sender: TObject);
var i: Integer;
    tmpDate: TDateTime;
begin
  Chart1.View3D:=false;
  Chart1.Legend.Visible:=false;
  tmpDate:=Today;

  with Chart1.AddSeries(TVolumeSeries) as TVolumeSeries do
  begin
    Marks.Visible:=true;
    XValues.DateTime:=true;

    for i:=0 to 9 do
    begin
      AddXY(tmpDate, 10*((i mod 3)+1),'this is a long label'+sLineBreak+'with number '+IntToStr(i));
      tmpDate:=IncDay(tmpDate, 3);
    end;
  end;

  Chart1.Axes.Left.SetMinMax(0,40);
  Chart1.Axes.Left.Grid.Visible:=false;

  Chart1.Axes.Bottom.Grid.Visible:=false;
  Chart1.Axes.Bottom.LabelStyle:=talValue;
  Chart1.Axes.Bottom.LabelsAngle:=90;
  Chart1.Axes.Bottom.Increment:=1;
  Chart1.Axes.Bottom.MinimumOffset:=50;
  Chart1.Axes.Bottom.MaximumOffset:=50;
end;
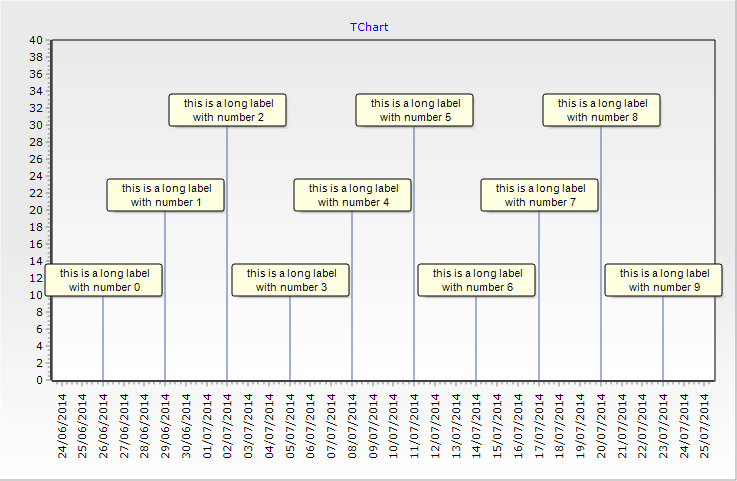
- Timeline.png (18.16 KiB) Viewed 30700 times