Page 1 of 1
Labels
Posted: Wed Aug 26, 2015 8:53 pm
by 15673788
Hi,
There's been some years since I made an user interface with a dynamically generated chart (or group of it) that between other things presents labels in a grid form in order to group some descriptions. I made it by calculating spaces occupied for each point and resizing the grid (other control) rows and columns. This works fine but as you can imagine, export it was impossible.
Is there any chance that this kind of charts was part of TeeChart functionalities set?
I've attached a simple demo, one of the possible chart, but the application can generate a lot more charts.
thank you in advance
Re: Labels
Posted: Thu Aug 27, 2015 7:04 am
by narcis
Hi Hermes,
Is this something similar to the SubAxes property available in TeeChart VCL? You can find it
here searching for SubAxes. If I'm not wrong, you are a TeeChart for .NET user. Is that correct?
Thanks for your feedback.
Re: Labels
Posted: Thu Aug 27, 2015 8:08 pm
by 15673788
Hi Narcís,
yes it is something similar to Sub axes, and yes, I'm a .NET user, even when the images belong to a vb6 application (com control).
If you wanna discuss something else (in spanish better) you can contact me and I'll explain all the details and possible uses.
thank you in advance
Re: Labels
Posted: Fri Aug 28, 2015 7:08 am
by narcis
Hi Hermes,
Thanks for your feedback.
Ok, you can post more information here (English or Spanish) or sent it to
info@steema.com with a reference to this thread.
Thanks again.
Re: Labels
Posted: Fri Sep 04, 2015 9:16 am
by Marc
Hello Hermes,
Thanks for the information you sent over. We're preparing a light example that might give you a few ideas to work with. Please bear with us a few days whilst it's being readied.
Regards,
Marc Meumann
Re: Labels
Posted: Mon Sep 07, 2015 2:13 pm
by Marc
Hello Hermes,
We've prepared a demo that shows some of what can be done with the current version of TeeChart.
The example uses custom drawing to the canvas to create grid and labels and uses custom axes to define the chart zones.
http://www.steema.com/files/public/WinF ... iChart.zip
All contents of the chart including grids are available for direct output to printer.
The image shows the application output.
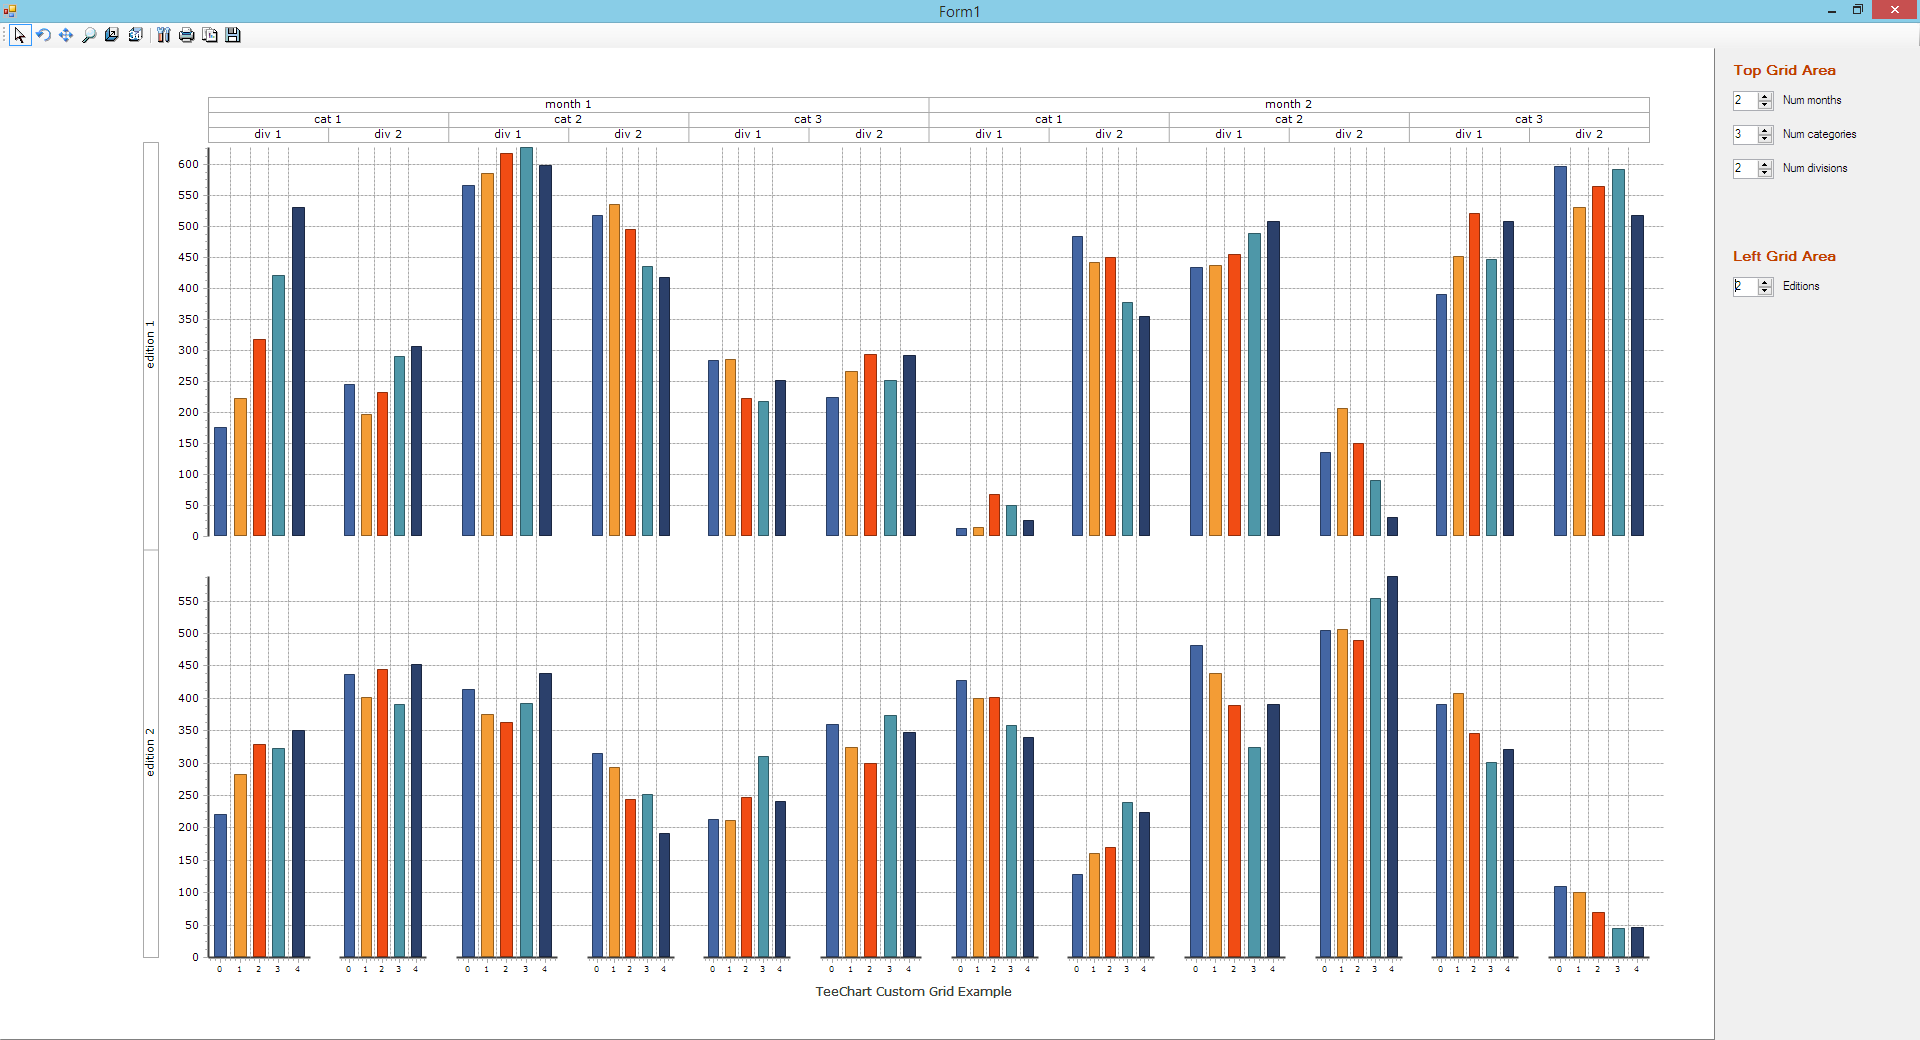
- TeeChart&GridDemo.png (117.74 KiB) Viewed 37903 times
An alternative option to custom axes could be to use the TeeChart SubChart tool to define Chart areas. The feature requested would make a useful addition to the Chart and is being reviewed for inclusion directly to the chart itself.
Regards,
Marc
Re: Labels
Posted: Tue Sep 08, 2015 3:48 pm
by Marc
As a followup. Copy pasting the Winform code into a WebForm (re-assigning the AfterDraw event to the WebChart) gives this output to the browser:
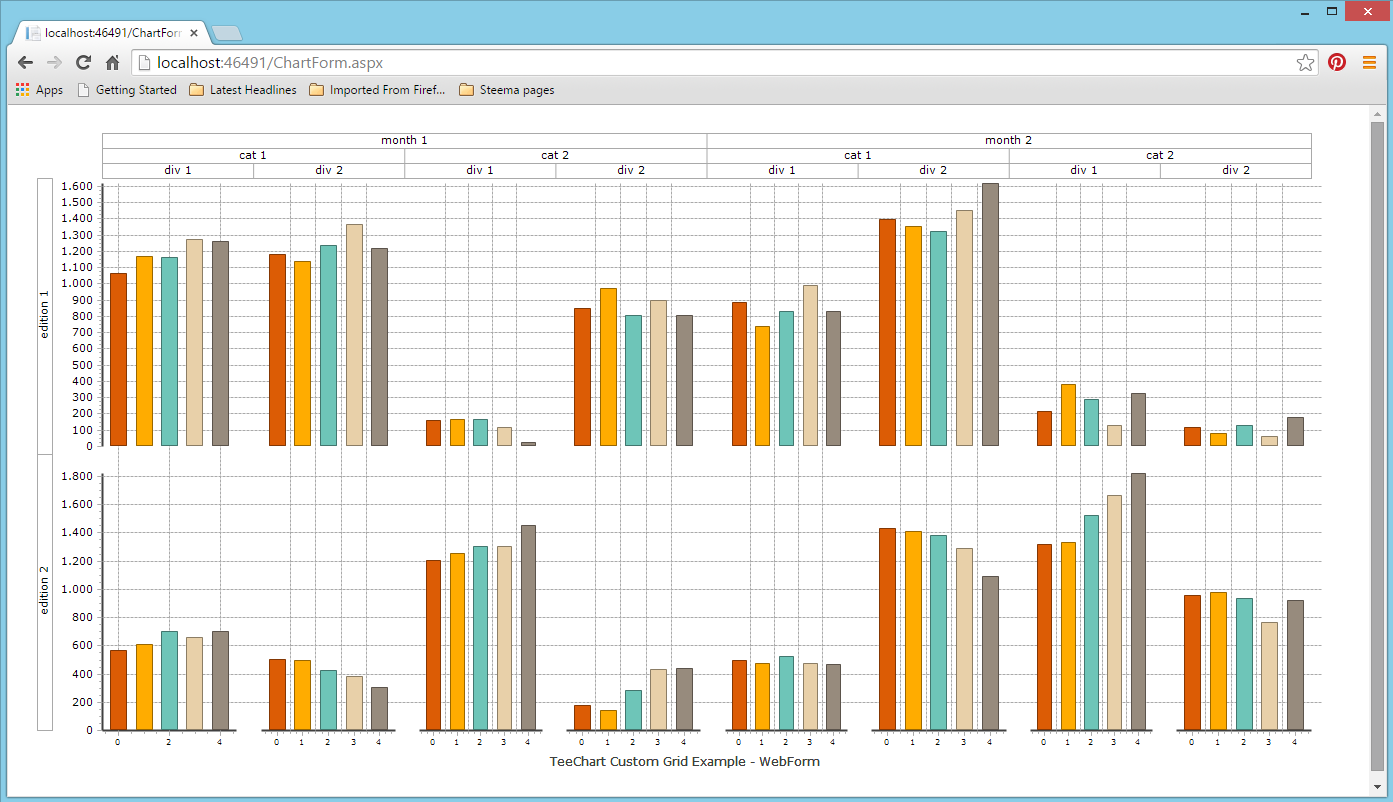
- TeeChart&GridWebFormDemo.png (62.32 KiB) Viewed 37894 times
The variables (Month, Category, Division and Edition) have been fixed for expediency and the colour palette has been changed to 'Seawash' to add a little variety.