Page 1 of 1
Bar chart panning
Posted: Wed Nov 06, 2019 10:04 am
by 18287324
We are using TeeChart Xamarin Forms nuget package version 4.2019.9.10
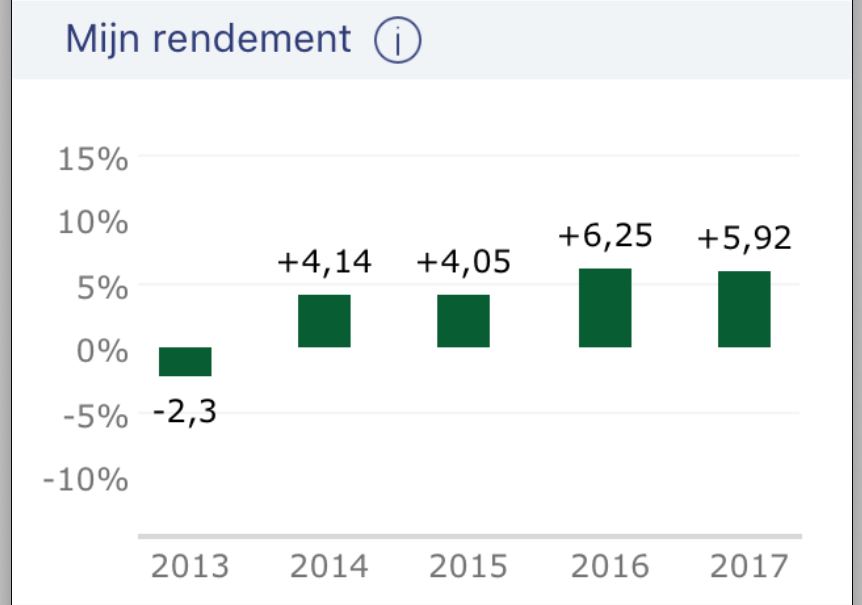
Currently our bar chart in the app looks like this:
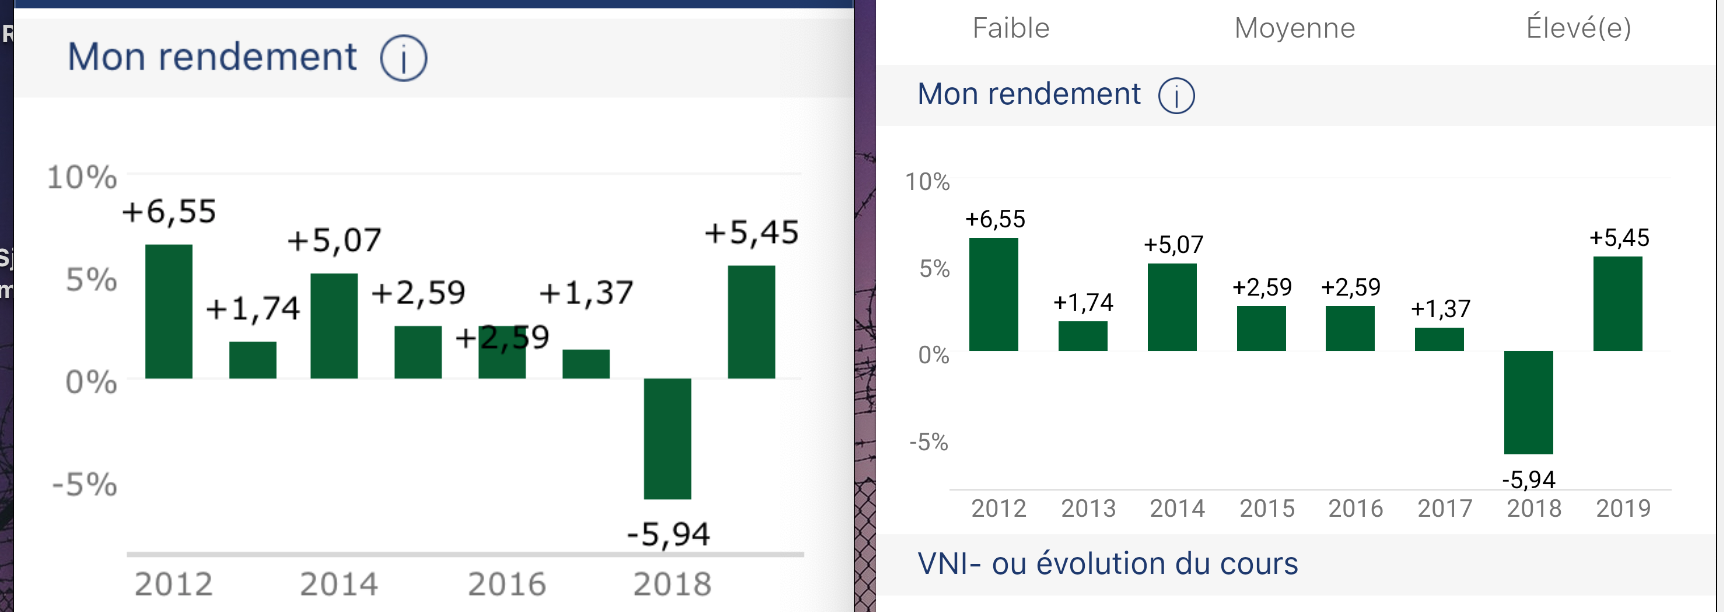
- Screen Shot 2019-11-06 at 10.45.49.png (249.26 KiB) Viewed 25983 times
So we want to allow more bars on the graph and are looking to allow the panning option.
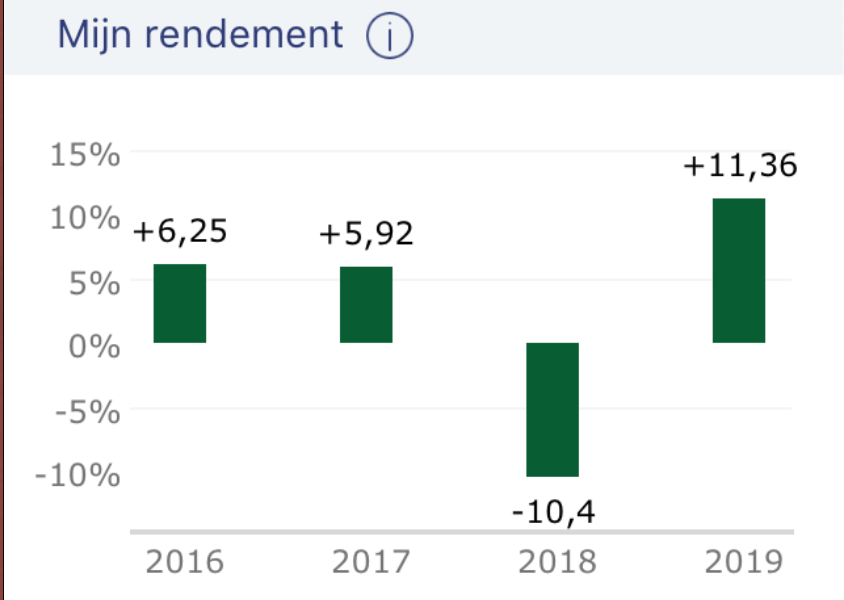
But when I set this option, the user can keep on panning left and right so that the actual graph moves completely out of view... example:
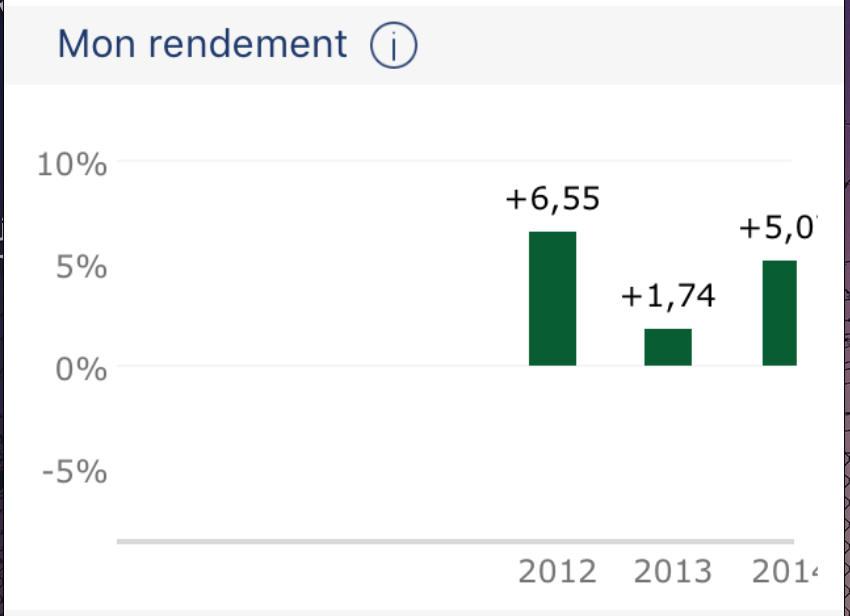
- Screen Shot 2019-11-06 at 10.53.56.png (77.68 KiB) Viewed 25983 times
So my question, how can I allow panning, but only so that the panning stops at the first left bar and last right bar?
Secondly even though I now set following code, the graph will not adjust the amount of visible bars.
Code: Select all
BarChart.Chart.Axes.Bottom.Automatic = false;
BarChart.Chart.Panning.Allow = Steema.TeeChart.ScrollModes.Horizontal;
BarChart.Chart.Axes.Bottom.Minimum = 0;
BarChart.Chart.Axes.Bottom.Maximum = 5;
I would like to validate that we have more than 5 years in our dataset and if so restrict the view of the graph to only show 5 and the rest through panning.
Final question, how do I position the graph to the end right bar if panning is active? Currently it will position itself to the first left bar.
Re: Bar chart panning
Posted: Fri Nov 08, 2019 11:24 am
by Pep
Hello,
So my question, how can I allow panning, but only so that the panning stops at the first left bar and last right bar?
You can use the following code in order to fix the scrolling to specific min and max :
Code: Select all
		int numValues = 50;

		bar1.FillSampleValues(numValues);
		tChart1.Scroll += TChart1_Scroll;

		// Set range or values to display on Chart
		tChart1.Axes.Bottom.SetMinMax(10, 20);

		private void TChart1_Scroll(object sender, EventArgs e)
		{
			if (tChart1.Axes.Bottom.Maximum > numValues)
				tChart1.Axes.Bottom.SetMinMax(numValues - 10, numValues);
			else
				if (tChart1.Axes.Bottom.Minimum < 0)
					tChart1.Axes.Bottom.SetMinMax(0, 10);
		}
I would like to validate that we have more than 5 years in our dataset and if so restrict the view of the graph to only show 5 and the rest through panning.
Try to sue the following code :
Code: Select all
BarChart.Chart.Axes.Bottom.Automatic = false;
BarChart.Chart.Panning.Allow = Steema.TeeChart.ScrollModes.Horizontal;
BarChart.Chart.Axes.Bottom.SetMinMax(0,5);
Final question, how do I position the graph to the end right bar if panning is active? Currently it will position itself to the first left bar.
I'm not sure what you refer here, but by using the SetMinMax method you should be able specify what values you want to look on the Chart althought the Panning is active. Does this helped ?
Re: Bar chart panning
Posted: Fri Nov 08, 2019 1:52 pm
by 18287324
Hey Pep,
Thank you very much for the detailed responses!
With your examples I'm almost able to get our graph to behave the way we want...
There is only 1 small detail I do not yet understand completely, maybe you can shed some extra light on this too?
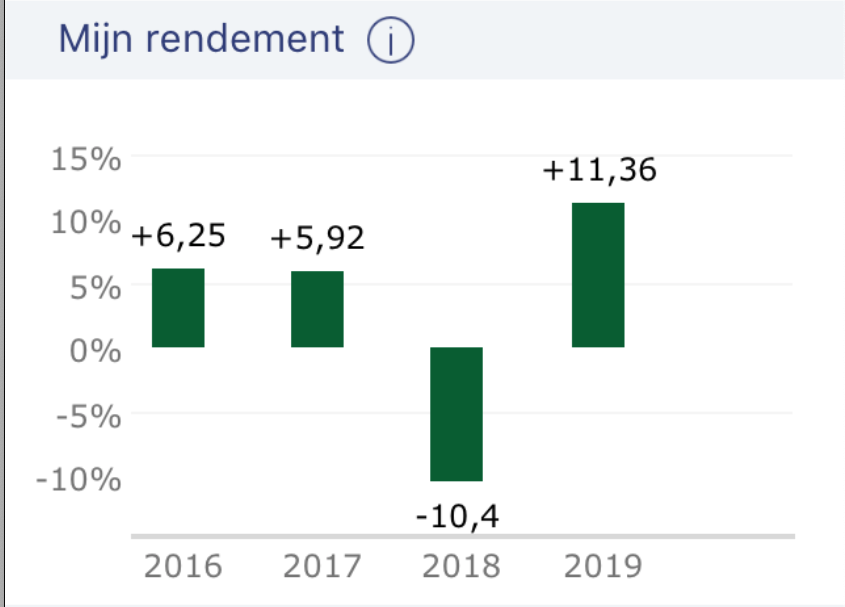
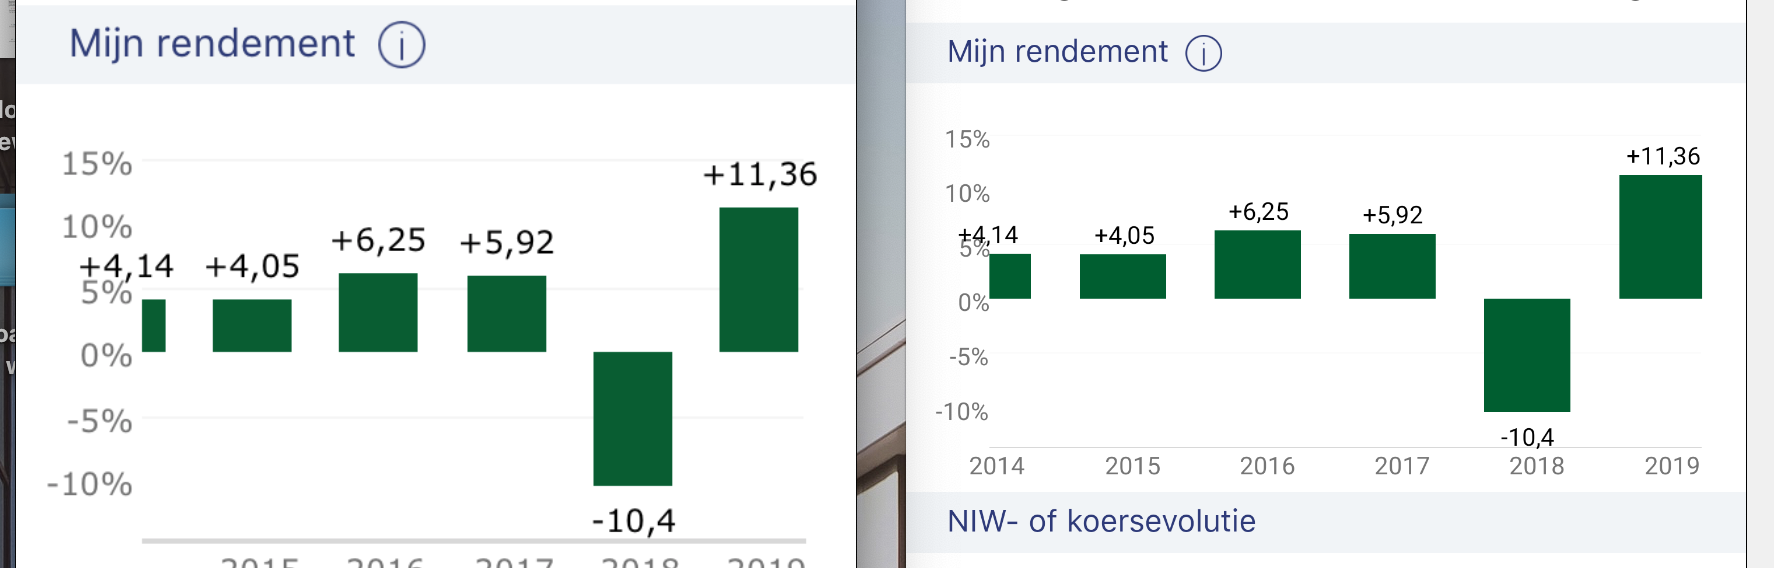
So if we look at a filled in chart with only 4 bars we set Chart.Axes.Bottom.Automatic = true. This gives us following result:
- Panning03.png (90.05 KiB) Viewed 25941 times
In other words the chart will put min and max value at the left and right edges of the graph and the bars will be evenly divided.
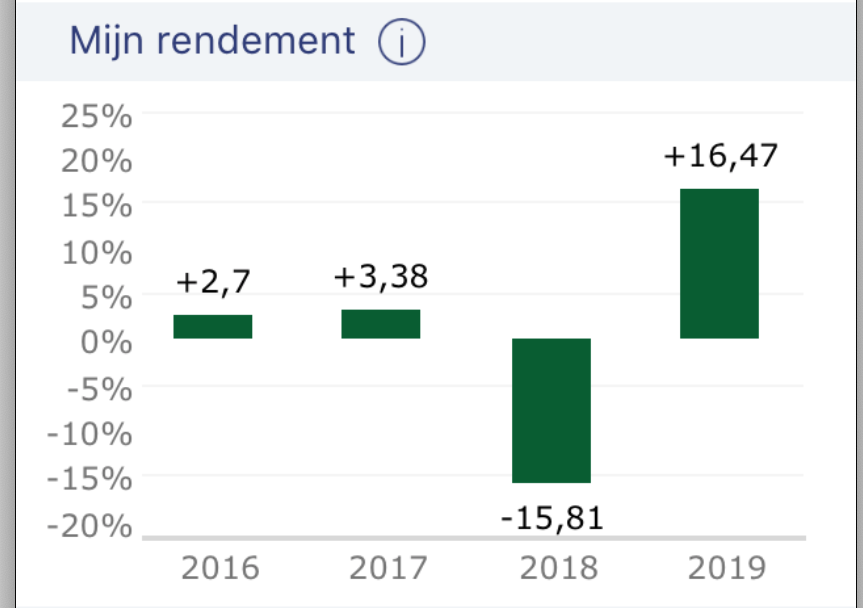
But when we have more than 4 bars, we set Chart.Axes.Bottom.Automatic = false and I now also put Chart.Axes.Bottom.SetMinMax(serie.Data.Count - 4, serie.Data.Count). This gives us:
- Panning01.png (67.95 KiB) Viewed 25941 times
- Panning02.png (81.15 KiB) Viewed 25941 times
Now first preview will position the graph correctly to only show 4 bars ( because I tweak this with SetMinMax ), but they are not evenly divided and we still see right white space.
Any way to still fix this? So that we have the same look and feel like as if we only have 4 bars... but still allow panning ofcourse?
Cheers
Re: Bar chart panning
Posted: Fri Nov 08, 2019 2:36 pm
by Pep
Hello,
I think that the problem is a minor mistake in the code, you use :
Code: Select all
Chart.Axes.Bottom.SetMinMax(serie.Data.Count - 4, serie.Data.Count)
and it should be :
Code: Select all
Chart.Axes.Bottom.SetMinMax(serie.Data.Count - 4, serie.Data.Count-1)
As it starts from 0. This should make the change.
Re: Bar chart panning
Posted: Fri Nov 08, 2019 2:45 pm
by 18287324
Of course and makes total sense

Sorry I missed that...
So the amount is perfect, but the bars are still smaller than the automatic generated ones...
- Screen Shot 2019-11-08 at 15.43.30.png (79.04 KiB) Viewed 25937 times
Our code does have bar.BarWidthPercent = 60; but this is always set. So even if we have automatic bottom axes true or false.
Re: Bar chart panning
Posted: Fri Nov 08, 2019 3:17 pm
by Pep
Ok
So the amount is perfect, but the bars are still smaller than the automatic generated ones...
Setting a number of points per page should solve it. Could you please adding :
Code: Select all
tChart1.Chart.Page.MaxPointsPerPage = 4;
Re: Bar chart panning
Posted: Tue Nov 12, 2019 9:15 am
by 18287324
Thx Pep! Works like a charm now.
]Just small side note, even thought this support forum is awesome and the detailed info is perfect. I do miss a lot of extra example code and explanation in the docs about all those different properties and methods.
Because we are only working on MacBooks we can't run the test app to try and tweak properties on the fly.
Re: Bar chart panning
Posted: Tue Nov 12, 2019 9:30 am
by 18287324
Hmm seems there is still 1 problem.
When panning is enabled, the values above the bars are shown out of bound of the graph.
Example attachment, the 4 is shown outside the graph on the left side although the bar itself stops at the left border.
- Screen Shot 2019-11-12 at 10.28.42.png (252.39 KiB) Viewed 25929 times
Re: Bar chart panning
Posted: Thu Nov 14, 2019 10:01 pm
by Pep
Hello,
you should be able to change the way that Series marks are displayed outside the Chart rect bounds by setting Clip to true for Series Marks :
Re: Bar chart panning
Posted: Fri Nov 15, 2019 12:54 pm
by 18287324
Thank you! Works great.