TeeChart for Microsoft Visual Studio .NET, Xamarin Studio (Android, iOS & Forms) & Monodevelop.
-
amol
- Advanced
- Posts: 231
- Joined: Tue Mar 29, 2005 5:00 am
Post
by amol » Wed Jul 04, 2018 12:22 pm
HI Steema,
I am facing following problem.
I need to display a bar chart and a line series on same plot. Line series have different y axis points but we have same axis for X(bottom)
My line is not going from middle of Bars. Please see below snaps.
I need below type chart with 2 series bar and line.
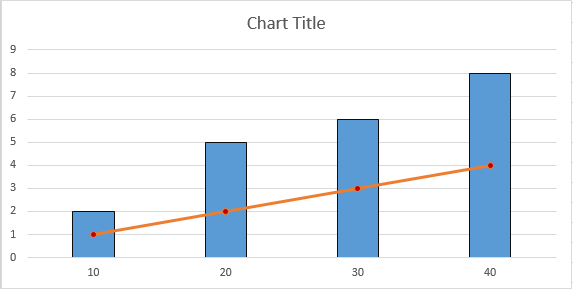
- x.png (7.26 KiB) Viewed 31544 times
I have fixed 6 point for line series and fix 6 bars but not able to generate plot like above image.
I have getting results like below image.
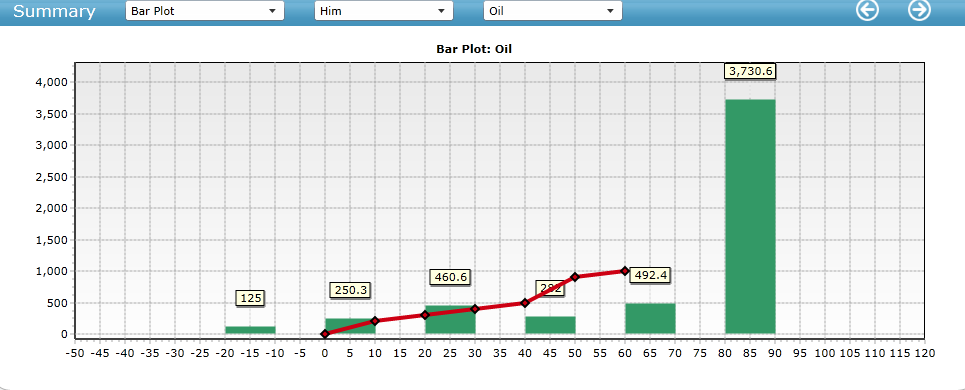
- qq.png (23.04 KiB) Viewed 31544 times
Please help me.
Thanks
Amol
-
Christopher
- Guru
- Posts: 1603
- Joined: Fri Nov 15, 2002 12:00 am
Post
by Christopher » Mon Jul 09, 2018 4:01 pm
Hello,
this code:
Code: Select all
		private void InitializeChart()
		{
			Bar bar = new Bar(tChart1.Chart);
			Line line = new Line(tChart1.Chart);
			line.Pointer.Visible = true;
			line.Pointer.InflateMargins = false;
			bar.Marks.Style = MarksStyles.Value;

			Random rnd = new Random();

			for (int i = 10; i < 100; i+=10)
			{
				int y = rnd.Next(100);
				bar.Add(y, i.ToString());
				line.Add(rnd.Next(y));
			}
		}
here gives me the following chart:
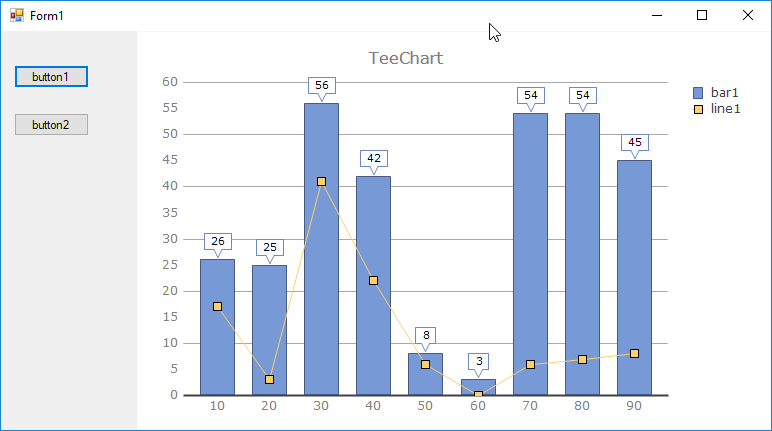
- TeeChartPro_2018-07-09_18-00-31.png (20.05 KiB) Viewed 31527 times
-
Christopher
- Guru
- Posts: 1603
- Joined: Fri Nov 15, 2002 12:00 am
Post
by Christopher » Mon Jul 09, 2018 4:11 pm
The same result can be obtained using this code:
Code: Select all
		private void InitializeChart()
		{
			Bar bar = new Bar(tChart1.Chart);
			Line line = new Line(tChart1.Chart);
			line.Pointer.Visible = true;
			line.Pointer.InflateMargins = false;
			bar.Marks.Style = MarksStyles.Value;

			Random rnd = new Random();

			for (int i = 10; i < 100; i+=10)
			{
				int y = rnd.Next(100);
				bar.Add(i, y);
				line.Add(i, rnd.Next(y));
			}
		}
giving me here:
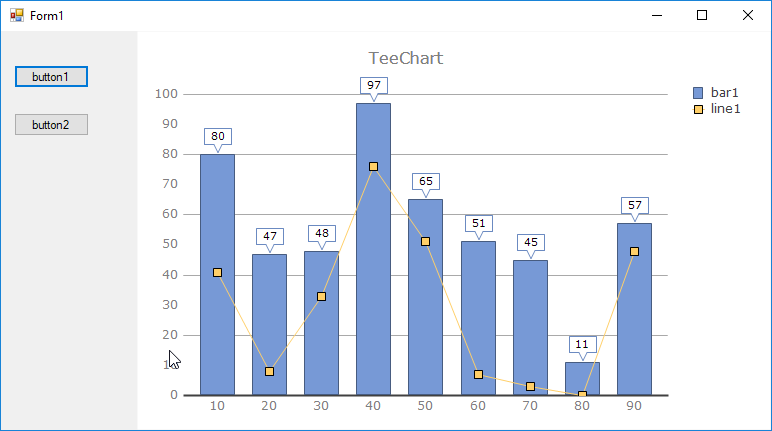
- TeeChartPro_2018-07-09_18-10-29.png (20.52 KiB) Viewed 31524 times
-
amol
- Advanced
- Posts: 231
- Joined: Tue Mar 29, 2005 5:00 am
Post
by amol » Tue Jul 10, 2018 8:14 am
Thanks you very much.
It helps.
Thanks
Amol