Page 1 of 1
Bar chart - negative values versus bottom axes
Posted: Fri May 04, 2018 12:23 pm
by 18281487
How do we compensate for the space needed to show negative bar marks?
Cfr screenshot
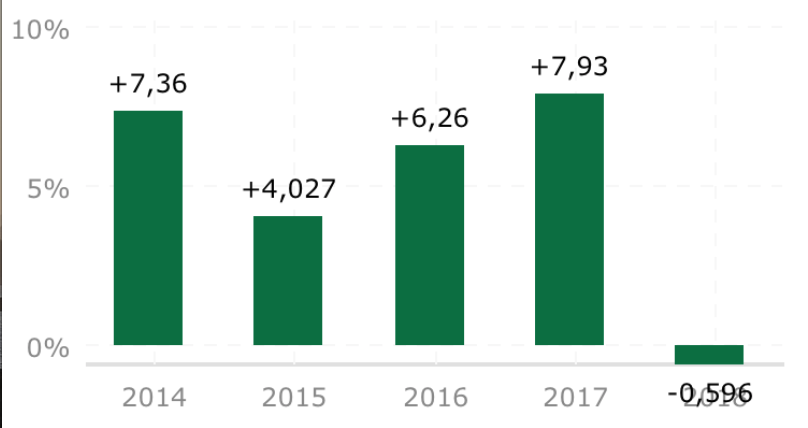
- Screen Shot 2018-05-04 at 14.17.54.png (50.24 KiB) Viewed 16623 times
The last bar has a negative value and now masks the bottom axes value. Can we fix this with some offset and if yes how do we calculate that margin?
Side question, can we manipulate the position of the bar marks? So that they will always be above the bar instead of following the value and be below the bar for negative values?
Re: Bar chart - negative values versus bottom axes
Posted: Mon May 07, 2018 8:20 am
by Christopher
Hello,
Using the latest version of the TeeChart.dll and the following code:
Code: Select all
		private void InitializeChart()
		{
			Bar bar = new Bar(tChart1.Chart);
			bar.Add(3);
			bar.Add(4);
			bar.Add(5);
			bar.Add(-2);
		}
I obtain this:
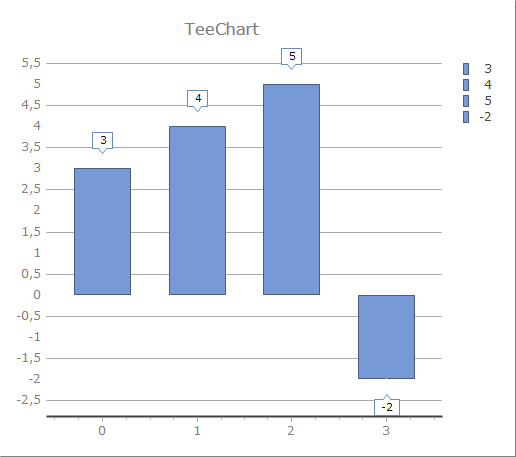
- TeeChartPro_2018-05-07_10-17-22.png (8.01 KiB) Viewed 16608 times
that is, TeeChart correctly calculates the margin in this default case. Could you please send me a simple code example of the code you're using to obtain the TeeChart in the image you sent? I can then add to this code to show you the options.
Re: Bar chart - negative values versus bottom axes
Posted: Mon May 07, 2018 8:47 am
by 18281487
The demo code for this is giving here :
http://www.teechart.net/support/viewtop ... =4&t=16893
If that does not render the same issue, I'll try to extract it from my project...
Re: Bar chart - negative values versus bottom axes
Posted: Mon May 07, 2018 2:30 pm
by 10050769
Hello Bank Van Breda,
The problem you're experiencing doesn't appear for us using the code below and latest TeeChart for Xamarin.Forms build 4.2018.4.26.
Code: Select all
    ChartView tChart1;

		public MainPage()
		{
			InitializeComponent();

			tChart1 = new ChartView();
			tChart1.Chart.Panning.Allow = ScrollModes.None;
			tChart1.Chart.Panel.Gradient.Visible = false;
			tChart1.Chart.Panel.Color = Color.White;

			tChart1.Chart.Walls.Back.Visible = false;
			tChart1.Chart.Header.Visible = false;
			tChart1.Chart.Legend.Visible = false;
			tChart1.Chart.Aspect.View3D = false;
			Steema.TeeChart.Styles.Bar bar1 = new Steema.TeeChart.Styles.Bar(tChart1.Chart);

			bar1.Add(7.36);
			bar1.Add(4.027);
			bar1.Add(6.26);
			bar1.Add(7.93);
			bar1.Add(-0.596);
			bar1.Color = Color.Green;
			bar1.Marks.Visible = true;
			bar1.Marks.Transparent = true;
			bar1.Marks.BackColor = Color.Transparent;
			bar1.Marks.Pen.Visible = false;
			bar1.Marks.TailStyle = Steema.TeeChart.Styles.MarksTail.None;
			bar1.Marks.Arrow.Visible = false;
			 bar1.Marks.Font.Size = 14;
			bar1.GetSeriesMark += Bar1_GetSeriesMark;
			tChart1.Chart.Axes.Left.Labels.Style = Steema.TeeChart.AxisLabelStyle.Text;
			tChart1.Chart.Axes.Left.Labels.Font.Size = 14;
			tChart1.Chart.Axes.Left.Ticks.Visible = true;
			tChart1.Chart.Axes.Left.MinorTicks.Visible = true;
			tChart1.Chart.Axes.Left.AxisPen.Visible = true;
			tChart1.Chart.Axes.Left.Grid.Visible = false;
			tChart1.Chart.Axes.Bottom.Grid.Visible = false;

			tChart1.Chart.Axes.Bottom.Labels.Font.Size = 18;
			tChart1.Chart.GetAxisLabel += Chart_GetAxisLabel;
			tChart1.Chart.Panel.MarginLeft = 30;

			tChart1.WidthRequest = 650;
			tChart1.HeightRequest = 350;


			Content = new StackLayout
			{
				Children =
									{
										tChart1
									},
				VerticalOptions = LayoutOptions.CenterAndExpand,
				HorizontalOptions = LayoutOptions.CenterAndExpand,
			};

		}

		private void Chart_GetAxisLabel(object sender, GetAxisLabelEventArgs e)
		{
			if (sender == tChart1.Chart.Axes.Left)
			{
				if (e.ValueIndex != -1)
				{
					e.LabelText = e.Series.YValues[e.ValueIndex].ToString() + "%";
				}
			}
		}


		private void Bar1_GetSeriesMark(Steema.TeeChart.Styles.Series series, Steema.TeeChart.Styles.GetSeriesMarkEventArgs e)
		{
			e.MarkText = "+ " + e.MarkText;
		}
You can show the results I have gotten below:
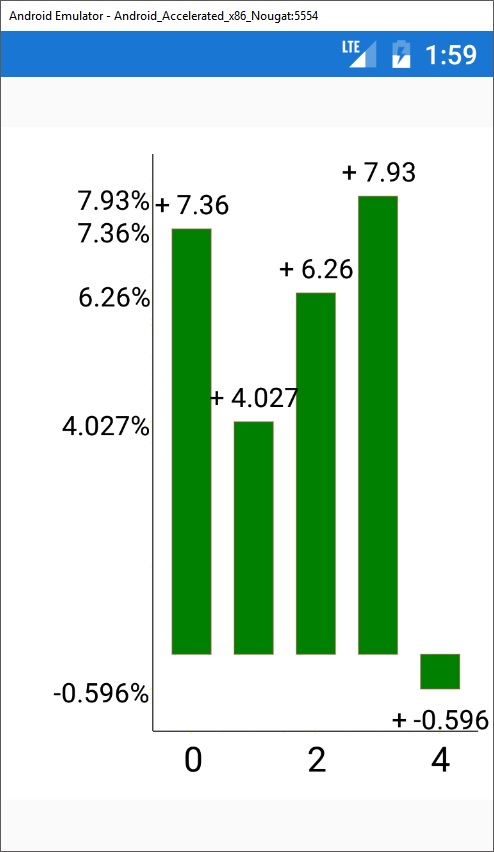
- Results.jpg (58.56 KiB) Viewed 16591 times
Could you confirm us you're using latest Teechart for Xamarin.Forms version?
Also, you may be interested in checking out the solutions suggested below to change marks positions:
http://www.teechart.net/support/viewtopic.php?t=5160
http://www.teechart.net/support/viewtopic.php?t=560
Hoping this helps you,
Thanks in advance
Re: Bar chart - negative values versus bottom axes
Posted: Tue May 08, 2018 2:38 pm
by 18281487
A small reply already...
Indeed in a test app with given example code this works fine!
In our production app, not. So I'm trying to rework the example app to see if I can spot the difference.

Re: Bar chart - negative values versus bottom axes
Posted: Tue May 08, 2018 3:12 pm
by 18281487
Found it... we manipulate left Max value mark
BarChart.Chart.Axes.Left.MaximumOffset = 5;
BarChart.Chart.Axes.Left.AutomaticMaximum = false;
BarChart.Chart.Axes.Left.Maximum = maxValue;
And that MaximumOffset is not needed!
Sorry, our bad

Re: Bar chart - negative values versus bottom axes
Posted: Wed May 09, 2018 12:49 pm
by 10050769
Hello Bank Van Breda,
Many thanks for the information. I'm glad you have found where the problem is produced.
Feel free contact us if you have more doubts.
Thanks in advance