Page 1 of 1
Line graph detail
Posted: Fri Apr 20, 2018 12:43 pm
by 18281487
Any pointers on how to get my current line graph
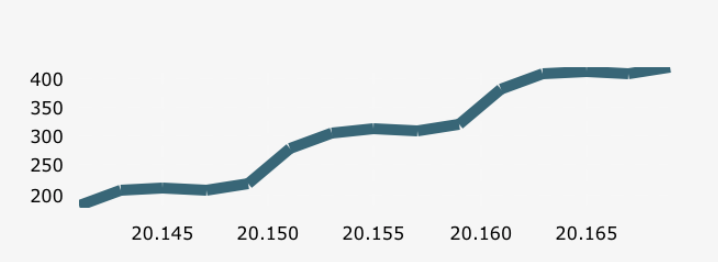
- Screen Shot 2018-04-20 at 14.38.34.png (34.8 KiB) Viewed 16316 times
Looking more like
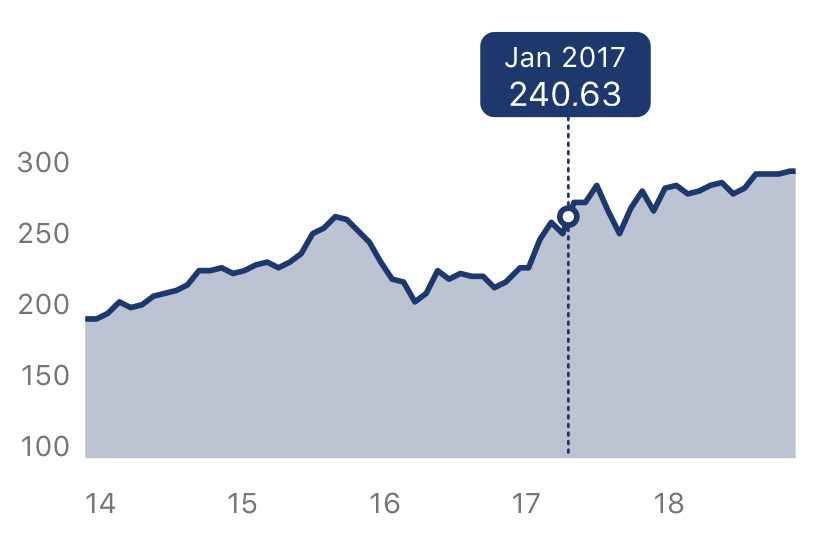
- Screen Shot 2018-04-20 at 14.40.31.png (46.02 KiB) Viewed 16317 times
Some questions:
1. Somehow I still see the marks on the line of the cross sections, so the line is not 1 smooth full color line
2. How do you enable the color fill from the bottom axes to the line?
3. Is there any graph touch interaction possible on the xamarin forms version, so that the user can move it's finger over the graph and we show a label at the mark selected?
Thanks
Re: Line graph detail
Posted: Mon Apr 23, 2018 11:36 am
by Pep
Hi,
I'm just preparing a very similar example to you. I'll upload it on our Steema github account today. I'll advise.
Re: Line graph detail
Posted: Mon Apr 23, 2018 1:05 pm
by Pep
I've uploaded a similar example on our github account which includes all the functionality you were asking. You can find it here :
https://github.com/Steema/teechart-xama ... PointerSTD
Re: Line graph detail
Posted: Tue Apr 24, 2018 7:59 am
by 18281487
Thanks!! Will take a look at it an try this out

Re: Line graph detail
Posted: Fri Apr 27, 2018 7:36 am
by 18281487
The github code is working great!
Only 1 small question still... if you look at my sample image, you will notice a 15 at the bottom.
This because I added DateTime values for the graph and set the Bottom Axes as follows:
AreaLineChart.Chart.Axes.Bottom.Increment = Steema.TeeChart.Utils.GetDateTimeStep(DateTimeSteps.OneYear);
AreaLineChart.Chart.Axes.Bottom.Labels.DateTimeFormat = "yy";
Now my question, although I increment per Year, the data also contains 2014 values. Can I make sure the left lower corner also has 14 visible?
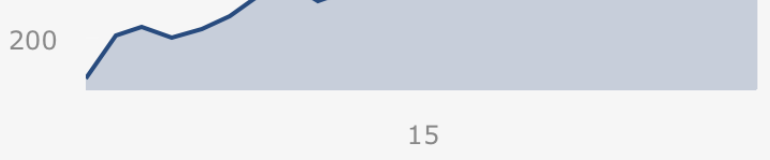
- Screen Shot 2018-04-25 at 10.47.12.png (13.93 KiB) Viewed 16254 times
Re: Line graph detail
Posted: Fri Apr 27, 2018 1:51 pm
by Pep
Hi Glenn,
some options here :
One way would by trying to add an extra offset for the bottom axis minimum and maximum :
Code: Select all
chart.Axes.Bottom.MinimumOffset = 100;
If this doesn't help, you can also add custom axis labels manually , please take a look at the following post, and in the case you still having problems let me know, so we can try to find a solution :
http://www.teechart.net/support/viewtopic.php?t=8392
Re: Line graph detail
Posted: Fri Apr 27, 2018 2:25 pm
by 18281487
Awesome, bottom.MinimumOffset and MaximumOffset does the trick, thanks!