
Hi again^^
Hopefully you can help me once more.
Now I have to draw lines in my 3D Chart.
Everything about Lines I found yet, is about drawing
them in 2D (Nothing like AddXYZ(x1,y1,z1,x2,y2,z3))
Background:
I have a set of values. All of them are related to some
special area where they where measured. No I
visualize these values with a SurfaceSeries. What I have to
do now is to visualize the borders between the special areas,
best would be on the SurfaceSerie itself.
Any suggestions?
thanks in advance,
HMI
Drawing Lines in 3D Chart
-
Narcís
- Site Admin

- Posts: 14730
- Joined: Mon Jun 09, 2003 4:00 am
- Location: Banyoles, Catalonia
- Contact:
Hi HMI,
The best option here may be using TPoint3DSeries which already has AddXYZ method. If you don't want to see the pointers you can do this:
The best option here may be using TPoint3DSeries which already has AddXYZ method. If you don't want to see the pointers you can do this:
Code: Select all
Series2.Pointer.Visible:=false;Best Regards,
| Narcís Calvet / Development & Support Steema Software Avinguda Montilivi 33, 17003 Girona, Catalonia Tel: 34 972 218 797 http://www.steema.com |
      |
| Instructions - How to post in this forum |
-
Narcís
- Site Admin
- Posts: 14730
- Joined: Mon Jun 09, 2003 4:00 am
- Location: Banyoles, Catalonia
- Contact:
Hi HMI,
Yes, that's what I mean, plotting 3D points with X,Y and Z coordinates but making the points not visible, just its connecting line.
Yes, that's what I mean, plotting 3D points with X,Y and Z coordinates but making the points not visible, just its connecting line.
Best Regards,
| Narcís Calvet / Development & Support Steema Software Avinguda Montilivi 33, 17003 Girona, Catalonia Tel: 34 972 218 797 http://www.steema.com |
| |
| Instructions - How to post in this forum |
Ok, back again from testing.
Although this idea is not bad, it fits not my requirements.
I try to explain it:
In this picture you can see an example graph
of my problem:

the problem is, that at the rising curve I only have the values from the
bottom and the top.
But the area change is between these two values.
If I interpolate the possible y values for the line, then it can
happen that the line is over or under the surface, depending on
the interpolation algorithm.
But by viewing this sample picture, I got another idea:
There are already lines at the surface(ContourPlot), one of these could fit my desired line. Is it possible to show only a specific contour line?
unfortunately I don't think so...
Kind regards,
HMI
Although this idea is not bad, it fits not my requirements.
I try to explain it:
In this picture you can see an example graph
of my problem:
the problem is, that at the rising curve I only have the values from the
bottom and the top.
But the area change is between these two values.
If I interpolate the possible y values for the line, then it can
happen that the line is over or under the surface, depending on
the interpolation algorithm.
But by viewing this sample picture, I got another idea:
There are already lines at the surface(ContourPlot), one of these could fit my desired line. Is it possible to show only a specific contour line?
unfortunately I don't think so...
Kind regards,
HMI
-
Narcís
- Site Admin
- Posts: 14730
- Joined: Mon Jun 09, 2003 4:00 am
- Location: Banyoles, Catalonia
- Contact:
Hi HMI,
Sorry but I don't understand what is your exact problem and what you are trying to achieve. Could you please give me more detailed information?
Thanks in advance.
Sorry but I don't understand what is your exact problem and what you are trying to achieve. Could you please give me more detailed information?
Thanks in advance.
Best Regards,
| Narcís Calvet / Development & Support Steema Software Avinguda Montilivi 33, 17003 Girona, Catalonia Tel: 34 972 218 797 http://www.steema.com |
| |
| Instructions - How to post in this forum |
Hi Narcis,
I thought it would not be easy to understand me^^
I try it again.
The image on which I try to explain:

I have a set of Gridpoints(regular positions, not that diffuse like in the picture), x and z for the position, y the value.
Theses Gridpoints belong to a "cell" (4 cell's in the sample).
What I want to do is visualize the cell borders.
But I only have the y values of the gridpoints.
If I want to draw a line representating the borders, I need
there "y values" to draw them "on" the surface.
To get those y values I can only interpolate between the gridpoints
around the cellborder. But by doing this it can happen that the y values
are not at the same level as the surfaceSerie in this point.
that would mean the line is under or above the Surfaceserie.
But I want it on top, like the ContourSeries lines.
Saying this, I thought it could be possible, if the contourSeries
shows only 1 specific y level line.
Is this possible?
Hope now it gets a bit clearer...
Kind regards,
Hmi
I thought it would not be easy to understand me^^
I try it again.
The image on which I try to explain:
I have a set of Gridpoints(regular positions, not that diffuse like in the picture), x and z for the position, y the value.
Theses Gridpoints belong to a "cell" (4 cell's in the sample).
What I want to do is visualize the cell borders.
But I only have the y values of the gridpoints.
If I want to draw a line representating the borders, I need
there "y values" to draw them "on" the surface.
To get those y values I can only interpolate between the gridpoints
around the cellborder. But by doing this it can happen that the y values
are not at the same level as the surfaceSerie in this point.
that would mean the line is under or above the Surfaceserie.
But I want it on top, like the ContourSeries lines.
Saying this, I thought it could be possible, if the contourSeries
shows only 1 specific y level line.
Is this possible?
Hope now it gets a bit clearer...
Kind regards,
Hmi
-
Narcís
- Site Admin
- Posts: 14730
- Joined: Mon Jun 09, 2003 4:00 am
- Location: Banyoles, Catalonia
- Contact:
Hi HMI,
Thanks for the information.
We think we understood what you are looking for. We suggest you to use 3 Points3D series like this:
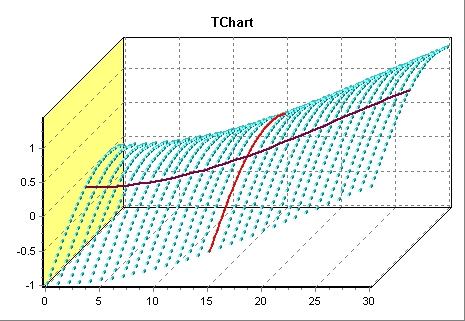
Instead of having Series2 and Series3 following Series1 data you could also set them to IrregularGrid=true and use double x and z values to plot an interpolated grid that fits your needs.
Also notice that Series1 is a Points3D series with no lines visible while Series2 and Series3 are Points3D series as well but only displaying its lines and no pointers.
Thanks for the information.
We think we understood what you are looking for. We suggest you to use 3 Points3D series like this:
Code: Select all
procedure TForm1.FormCreate(Sender: TObject);
var
x, z, numValues : Integer;
begin
  numValues:=30;

  for x:=0 to numValues do
    for z:=0 to numValues do
      Begin
        Series1.AddXYZ(x,Sin(z/numValues*2)-Cos(x/numValues*2),z);
        if (x=15) then
          Series2.AddXYZ(x,Series1.YValues.Last,z);
        if (z=15) then
          Series3.AddXYZ(x,Series1.YValues.Last,z);
      end;
end;Also notice that Series1 is a Points3D series with no lines visible while Series2 and Series3 are Points3D series as well but only displaying its lines and no pointers.
Best Regards,
| Narcís Calvet / Development & Support Steema Software Avinguda Montilivi 33, 17003 Girona, Catalonia Tel: 34 972 218 797 http://www.steema.com |
| |
| Instructions - How to post in this forum |