Page 1 of 1
Charts with "Milestone" bubbles?
Posted: Thu Oct 14, 2021 7:07 pm
by 16589977
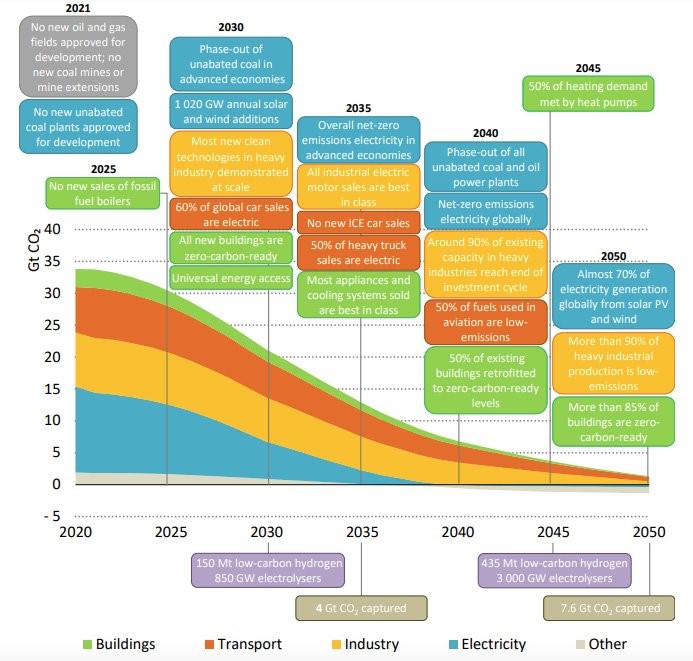
Hi all - has anyone used TeeChart to create something like this?
Specifically, I'm looking to be able to add "milestones" to a chart that has years on the X axis, with the color of each milestone set the same as the legend series. Any pointers on how one might do this gratefully accepted.
Thanks in advance!
Re: Charts with "Milestone" bubbles?
Posted: Fri Oct 15, 2021 11:06 am
by yeray
Hello,
I'd use
TAnnotationTools to draw both the text shapes at the top and at the bottom.
Code: Select all
uses Series, TeeTools;

procedure TForm1.FormCreate(Sender: TObject);
var i, j: Integer;
begin
  Chart1.Align:=alClient;
  Chart1.Gradient.Visible:=False;
  Chart1.Color:=clWhite;
  Chart1.Walls.Back.Gradient.Visible:=False;
  Chart1.Walls.Back.Color:=clWhite;
  Chart1.Walls.Back.Visible:=False;
  Chart1.Legend.Hide;
  Chart1.View3D:=False;

  for i:=0 to 4 do
    with TAreaSeries(Chart1.AddSeries(TAreaSeries)) do
    begin
      XValues.DateTime:=True;
      FillSampleValues;
      for j:=0 to Count-1 do
        XValues[j]:=StrToDate('1/1/'+IntToStr(2021+j));

      MultiArea:=maStacked;
      Smoothed:=True;
      AreaLinesPen.Hide;
    end;

  Chart1.MarginTop:=30;
  Chart1.Axes.Bottom.DateTimeFormat:='yyyy';

  Chart1.Draw;

  with TAnnotationTool(Chart1.Tools.Add(TAnnotationTool)) do
  begin
    Text:='This is another text'+sLineBreak+'for 2021';
    Shape.ShapeStyle:=fosRoundRectangle;
    Shape.Margins.Left:=20;
    Shape.Margins.Right:=20;
    Shape.Margins.Top:=10;
    Shape.Margins.Bottom:=10;
    Shape.Color:=Chart1[0].Color;
    Shape.Font.Color:=clWhite;
    Shape.Font.Style:=Shape.Font.Style+[fsBold];
    Left:=Chart1.Axes.Bottom.CalcPosValue(StrToDate('1/1/2021'));
    Top:=Chart1.ChartRect.Top-Bounds.Height-20;
  end;
  with TAnnotationTool(Chart1.Tools.Add(TAnnotationTool)) do
  begin
    Text:='This is some text'+sLineBreak+'for 2021';
    Shape.ShapeStyle:=fosRoundRectangle;
    Shape.Margins.Left:=20;
    Shape.Margins.Right:=20;
    Shape.Margins.Top:=10;
    Shape.Margins.Bottom:=10;
    Shape.Color:=Chart1[1].Color;
    Shape.Font.Color:=clWhite;
    Shape.Font.Style:=Shape.Font.Style+[fsBold];
    Left:=Chart1.Axes.Bottom.CalcPosValue(StrToDate('1/1/2021'));
    Top:=TAnnotationTool(Chart1.Tools[0]).Top-Bounds.Height-10;
  end;
  with TAnnotationTool(Chart1.Tools.Add(TAnnotationTool)) do
  begin
    Text:='2021';
    Shape.Shadow.Hide;
    Shape.Pen.Hide;
    Shape.Font.Style:=Shape.Font.Style+[fsBold];
    Left:=Chart1.Axes.Bottom.CalcPosValue(StrToDate('1/1/2021'));
    Top:=TAnnotationTool(Chart1.Tools[1]).Top-Bounds.Height-10;
  end;
end;
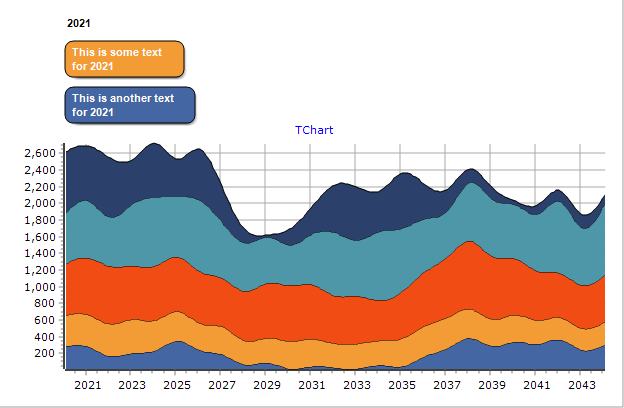
- Annotations.png (21.63 KiB) Viewed 10688 times
However, if you want to calculate the positions of all the annotations dynamically, the logic wouldn't be trivial.
Re: Charts with "Milestone" bubbles?
Posted: Fri Oct 22, 2021 10:56 am
by 16587558
Excellent - many thanks!