Page 1 of 1
Title‘s Colors in ChartListBox
Posted: Wed Sep 30, 2020 2:01 am
by 16586272
I hope to show Titles using the same Color with its corresponding Series in a ChartListBox, but Title‘s Color is not consistent with SeriesColor in ChartListBox.
Code: Select all
  with aChartListBox do
    begin
      Chart := aChart;
      EnableChangeType := false;
      EnableChangeColor := true;
      EnableDragSeries := false;
      ShowSeriesIcon := false;
      ShowActiveCheck := true;
      ShowSeriesColor := true;
      ShowSeriesTitle := true;
      FontSeriesColor := true;
      AllowDeleteSeries := false;
      AllowAddSeries := false;
    end;
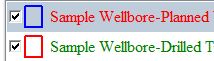
- Color.jpg (5.35 KiB) Viewed 13853 times
Re: Title‘s Colors in ChartListBox
Posted: Wed Sep 30, 2020 9:16 am
by yeray
Hello,
It seems to work fine for me here:
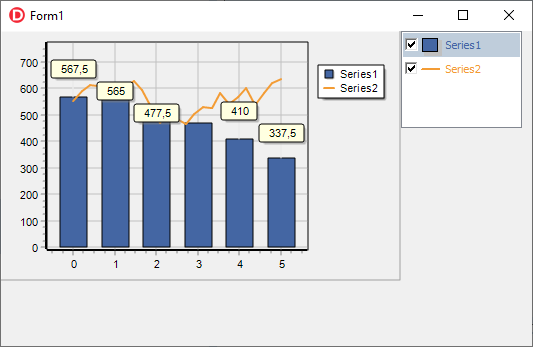
- Project1_2020-09-30_11-15-02.png (14.41 KiB) Viewed 13845 times
Code: Select all
procedure TForm1.FormCreate(Sender: TObject);
var Chart1: TChart;
    ChartListBox1: TChartListBox;
begin
  Chart1:=TChart.Create(Self);
  ChartListBox1:=TChartListBox.Create(Self);

  with Chart1 do
  begin
    Parent:=Self;
    View3D:=False;
    AddSeries(TBarSeries).FillSampleValues;
    with TLineSeries(AddSeries(TLineSeries)) do
    begin
      FillSampleValues;
      Pen.Width:=2;
    end;
  end;

  with ChartListBox1 do
  begin
    Parent:=Self;
    Left:=Chart1.Width;
    Chart := Chart1;
    EnableChangeType := false;
    EnableChangeColor := true;
    EnableDragSeries := false;
    ShowSeriesIcon := false;
    ShowActiveCheck := true;
    ShowSeriesColor := true;
    ShowSeriesTitle := true;
    FontSeriesColor := true;
    AllowDeleteSeries := false;
    AllowAddSeries := false;
  end;
end;
If you still find problems with it, please arrange a simple example project we can run as-is to reproduce the problem here.
Thanks in advance.
Re: Title‘s Colors in ChartListBox
Posted: Thu Oct 01, 2020 3:00 am
by 16586272
Please find attached.
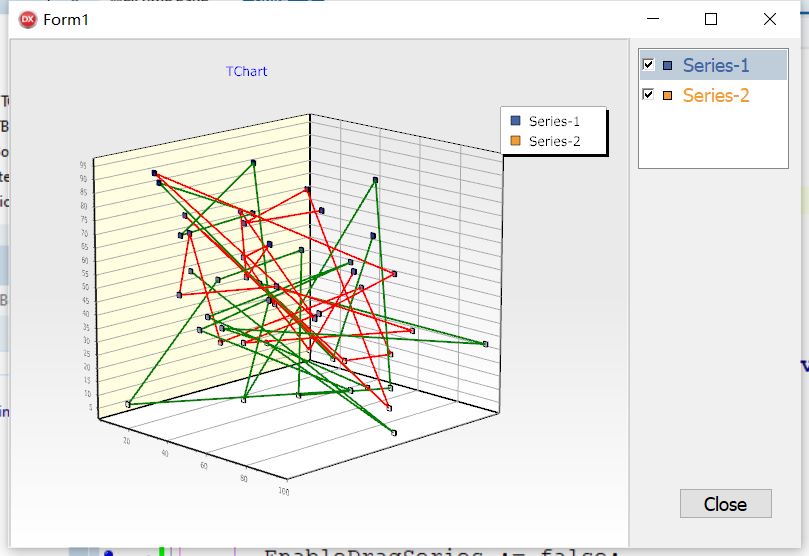
- Point3D.jpg (66.09 KiB) Viewed 13837 times
Re: Title‘s Colors in ChartListBox
Posted: Thu Oct 01, 2020 6:30 am
by yeray
Hello,
You are setting the series LinePen.Color, which is ok for the lines connecting the 3d points, but you should set the main series' Color.
Re: Title‘s Colors in ChartListBox
Posted: Mon Sep 27, 2021 4:41 am
by 16586272
How to change the Color tag/band (between ActiveCheck and SeriesTitle) from “square” to “line”?
Re: Title‘s Colors in ChartListBox
Posted: Mon Sep 27, 2021 9:02 am
by 16586272
How to change the Color tag/band (between ActiveCheck and SeriesTitle) from “square” to “line”?
Please find the attached file and the hand tag.
Re: Title‘s Colors in ChartListBox
Posted: Mon Sep 27, 2021 9:36 am
by yeray
Hello,
Depending on the series style it will be changing the Series'
Pointer.Color, or just the Series'
Color. Ie
Code: Select all
TBarSeries(Chart1[0]).Color:=clRed;
Code: Select all
TPoint3DSeries(Chart1[0]).Pointer.Color:=clRed;
Re: Title‘s Colors in ChartListBox
Posted: Mon Sep 27, 2021 2:00 pm
by 16586272
I want to change its shape shown in the ChartListBox, not color.
Re: Title‘s Colors in ChartListBox
Posted: Mon Sep 27, 2021 5:05 pm
by yeray
Hello,
Ups.

In that case you could use a dummy
TLineSeries - which symbol is drawn as a "line" when in 2D - and hide the
TBarSeries - which is drawn as a "square" when in 2D - from the legend and editor. Ie:
Code: Select all
uses Series;

procedure TForm1.FormCreate(Sender: TObject);
begin
  Chart1.View3D:=False;

  Chart1.Gradient.Visible:=False;
  Chart1.Color:=clWhite;
  Chart1.Walls.Back.Visible:=False;
  Chart1.Walls.Back.Color:=clWhite;

  with Chart1.AddSeries(TBarSeries) do
  begin
    FillSampleValues;
    ShowInLegend:=False;
    ShowInEditor:=False;
    Title:='Series1';
  end;

  //dummy series for the legend
  with Chart1.AddSeries(TLineSeries) do
  begin
    Title:=Chart1[0].Title;
    Color:=Chart1[0].Color;
  end;

  with Chart1.AddSeries(TLineSeries) do
  begin
    FillSampleValues;
    Title:='Series2';
  end;

  ChartListBox1.Chart:=Chart1;
end;
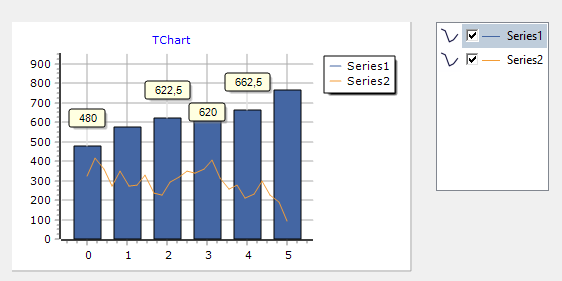
- chartlist_dummy_symbol.png (13.07 KiB) Viewed 8978 times