Page 1 of 1
Creating a Bar Chart limited to a Single Record
Posted: Wed Jul 29, 2020 8:32 pm
by 16487010
How can I limit a stacked bar chart to a single record from a query? I need to be able to have the chart appear to the user in a ReportBuilder Report based on current record. I have done this for 15 years or so in FastReports, but need to move beyond them for other reasons.
Re: Creating a Bar Chart limited to a Single Record
Posted: Thu Jul 30, 2020 8:44 am
by yeray
Hello,
The easiest way I can think to do this is by setting the bottom axis to just show the last value. Ie:
Code: Select all
  with Chart1[0] do
  begin
    diff:=(XValues.Last-XValues[Count-2]) / 2;
    Chart1.Axes.Bottom.SetMinMax(XValues.Last-diff, XValues.Last+diff);
  end;
Re: Creating a Bar Chart limited to a Single Record
Posted: Thu Jul 30, 2020 12:47 pm
by 16487010
Maybe I need to provide more detail. I have a series of records in a table that has three values I want to place in a stacked bar chart - Total Budget, Current Invoice, and Previous Invoices. As the report generator steps through the table, it needs to provide a chart based on the three fields in that particular record. Right now the bar chart provides separate stacked bars for the entire table all at once.
Re: Creating a Bar Chart limited to a Single Record
Posted: Thu Jul 30, 2020 6:48 pm
by 16487010
I solved the problem by setting up a FDMemTable to provide data to the chart. As my Query steps through it's data, it triggers an OnDataChange event. I use this event to empty the MemTable and then copy the values I need from the Query to the MemTable. It works perfectly.
Re: Creating a Bar Chart limited to a Single Record
Posted: Fri Jul 31, 2020 6:24 am
by yeray
Hello,
I may be missing something else because I still think the same code applies here.
Here a simple example showing three stacked bars with several values:
Code: Select all
var
  i: Integer;
const
  titles: array[0..2] of string = ('Total Budget', 'Current Invoice', 'Previous Invoices');
begin
  for i:=0 to 2 do
  begin
    with TBarSeries(Chart1.AddSeries(TBarSeries)) do
    begin
      Title:=titles[i];
      FillSampleValues;
      MultiBar:=mbStacked;
      Marks.Hide;
    end;
  end;

  Chart1.Legend.Alignment:=laBottom;
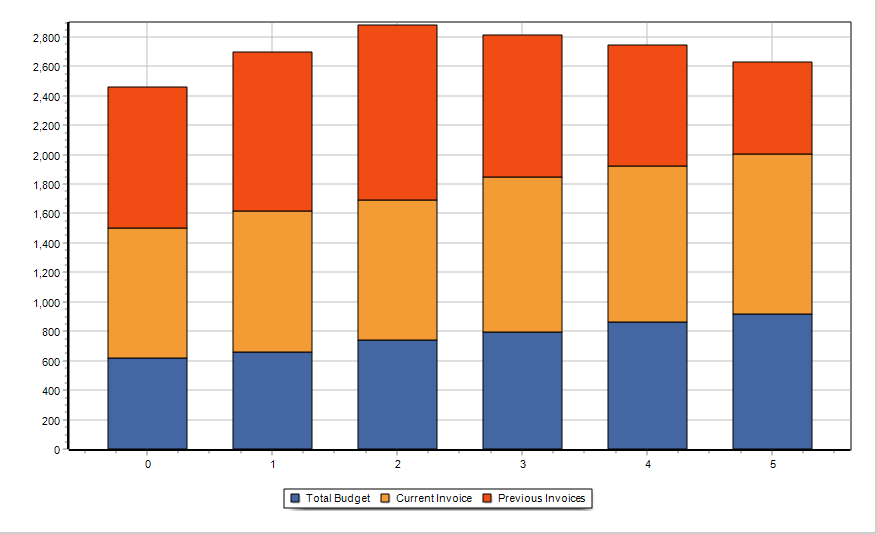
- all.png (7.41 KiB) Viewed 11277 times
Here the same chart after calling that code to only show the last bar:
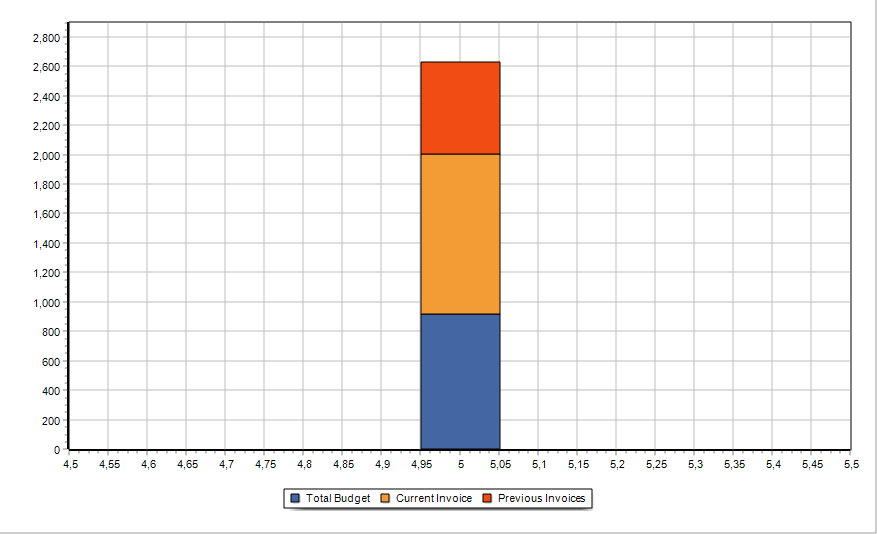
- last.png (8.66 KiB) Viewed 11277 times
If you still find problems with it, please arrange a simple example project we can run as-is to reproduce the problem here.
Thanks in advance.