Page 1 of 1
Labelling data points
Posted: Fri Feb 28, 2020 5:48 am
by 16586540
I have a array, each element consisting of three values, X, Y, Value. I wish to plot these as a point series on a DBChart, with the value written besides each point. I have looked through your forum and the Tee9New program, but cannot find how to get started.
Besides writing the value besides each point, I wish to control the position of the Value relative to the point, including font size, angle, etc.
I would be grateful if you can point me towards a simple example that demonstrates this.
Thanks and regards
Errol
Re: Labelling data points
Posted: Mon Mar 02, 2020 3:48 am
by 16586540
Further to my previous post, I have found that I can use TPointSeries.Labels to write labels, and the ChartAfterDraw even to write them in the correct position. However, I do seem able to skip a label - i.e. not write a label at some of the series points. The corresponding Y-value is always written when I set the label to ''.
Thanks and regards
Errol
Re: Labelling data points
Posted: Mon Mar 02, 2020 9:45 am
by yeray
Hello Errol,
I would try to use custom labels. Here a simple example:
Code: Select all
const XVal: array of double = [0,1,2,3,4,5,6,7,8,9];
      YVal: array of double = [5,6,7,5,3,4,5,6,7,8];
      Labl: array of double = [18,-15,-12,12,15,13,13,11,0,14];
      XOff: array of double = [0,0,0,20,-20,0,0,0,0,0];
      YOff: array of double = [0,0,0,0,0,0,60,-20,0,0];

procedure TForm1.FormCreate(Sender: TObject);
var i: Integer;
begin
  Chart1.View3D:=False;
  Chart1.Legend.Hide;
  Chart1.Axes.Bottom.LabelStyle:=talValue;
  Chart1.Axes.Bottom.Grid.Hide;
  Chart1.Axes.Left.Grid.Hide;
  Chart1.Axes.Left.SetMinMax(0,10);
  Chart1.Axes.Left.Increment:=1;
  Chart1.Gradient.Visible:=False;
  Chart1.Walls.Visible:=False;

  with TPointSeries(Chart1.AddSeries(TPointSeries)) do
  begin
    Marks.Visible:=True;
    Marks.Style:=smsLabel;
    Marks.ArrowLength:=15;
    Marks.Arrow.Color:=clBlack;

    for i:=0 to High(XVal) do
    begin
      if Labl[i]<=0 then
        AddXY(XVal[i],YVal[i],'')
      else
        AddXY(XVal[i],YVal[i],FormatFloat(ValueFormat,Labl[i]));

      Marks.Item[i].Font.Size:=Round(Labl[i]);
    end;

    Chart1.Draw;
    OnGetMarkText:=SeriesGetMarkText;
  end;
end;

Procedure TForm1.SeriesGetMarkText(Sender:TChartSeries; ValueIndex:Integer; var MarkText:String);
var
  APosition: TSeriesMarkPosition;
  XPos,YPos: Integer;
begin
  inherited;

  with Sender do
  begin
    APosition:=Marks.Positions[ValueIndex];

    if APosition=nil then
    begin
      APosition:=TSeriesMarkPosition.Create;
      APosition.Custom:=True;
    end;

    XPos:=CalcXPos(ValueIndex);
    YPos:=CalcYPos(ValueIndex);
    APosition.LeftTop.X:=XPos-(APosition.Width div 2)+Round(XOff[ValueIndex]);
    APosition.LeftTop.Y:=YPos-APosition.Height-Marks.ArrowLength+Round(YOff[ValueIndex]);
    APosition.ArrowFrom:=Point(XPos,YPos);
    APosition.ArrowTo:=Point(APosition.LeftTop.X+(APosition.Width div 2),APosition.LeftTop.Y+(APosition.Height div 2));
    Marks.Positions[ValueIndex]:=APosition;
  end;
end;
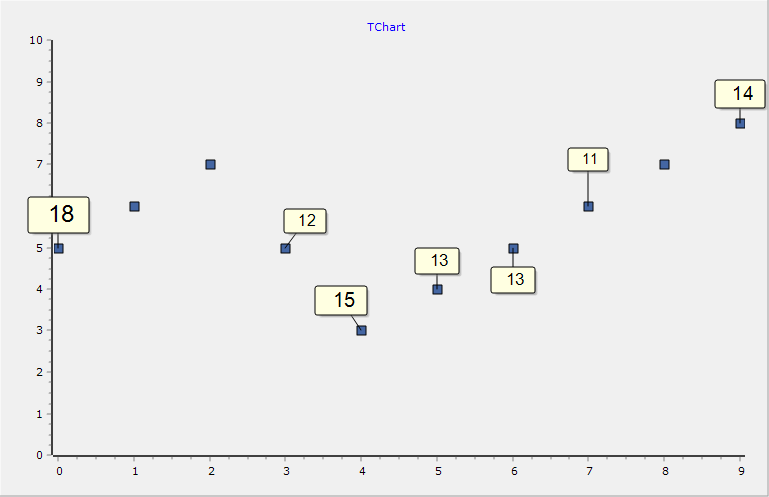
- Project1_2020-03-02_10-44-37.png (10.1 KiB) Viewed 10217 times