Page 1 of 1
THistogramSeries % Bar Width
Posted: Wed Apr 20, 2016 5:13 pm
by 16575285
Hi,
What does this property do? Setting it to 100% produces bars that overlap. The value I need to obtain non-overlapping bars is much less than this, but varies according to the zoom. What does 100% mean? There seems not to be any help for this class. I'm using in TeeChart Pro v2014.12.140923 32-bit VCL in XE7.
Regards
Toreba
Re: THistogramSeries % Bar Width
Posted: Thu Apr 21, 2016 1:42 pm
by yeray
Hello Toreba,
Could you please arrange a simple example project showing us what are you exactly doing?
Thanks in advance.
Re: THistogramSeries % Bar Width
Posted: Mon Apr 25, 2016 3:35 pm
by 16575285
Yeray,
I'm sorry, I was wrong (again). THistogramSeries works fine, and doesn't offer a % bar width property. It is In fact TBarSeries for which the property makes no sense. Do you agree with that?
Regards
Toreba
Re: THistogramSeries % Bar Width
Posted: Tue Apr 26, 2016 7:53 am
by yeray
Hello Toreba,
There are 3 properties with similar names that could be confusing you. From the
online docs:
TCustomBarSeries.BarWidthPercent wrote:TCustomBarSeries.BarWidthPercent
TCustomBarSeries
property BarWidthPercent: Integer;
Unit
Series
Description
Default Value: 70
The BarWidthPercent property determines the percent of total Bar width used. Setting BarWidthPercent := 100 makes joined Bars. You can control how many Bars appear at same time by using TChart.MaxPointsPerPage property. The BarWidth and BarHeight properties indicate Bar dimensions in pixels.
TBarSeries.BarWidth wrote:TBarSeries.BarWidth
TBarSeries
property BarWidth: Integer;
Unit
Series
Description
Run time and read only. The BarWidth property returns the width of vertical Bars in pixels. Bar widths change at run-time when resizing or zooming the Chart. BarWidth is a read-only property. You can use the
CustomBarWidth property to set a fixed pixels Bar width.
TBarSeries.CustomBarWidth wrote:TBarSeries.CustomBarWidth
TBarSeries
property CustomBarWidth: Integer;
Unit
Series
Description
Default: 0
The CustomBarWidth property determines the fixed Bar width in pixels. You can use the
BarWidth property to get the current Bar width in pixels.
Which one doesn't behave as you'd expect?
Re: THistogramSeries % Bar Width
Posted: Wed Apr 27, 2016 1:47 pm
by 16575285
Yeray,
I think it's the first of these properties that doesn't work, at least using v2014.12.140923 32-bit in XE7. It's easy to show with a simple demo. Do you need me to provide one?
Regards
Toreba
Re: THistogramSeries % Bar Width
Posted: Fri Apr 29, 2016 11:30 am
by yeray
Hi toreba,
This is what I get with v2012.14 and the code below:
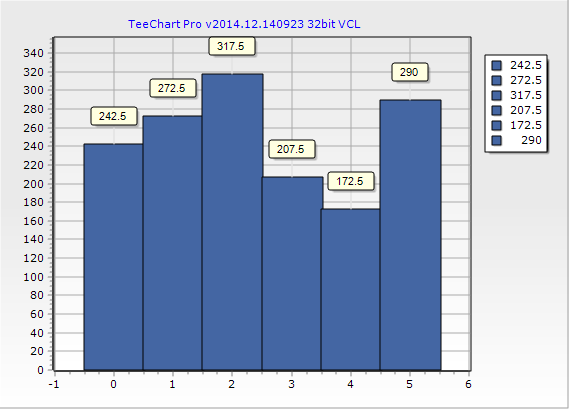
- testBarWidthPercent.png (14.14 KiB) Viewed 19860 times
Code: Select all
uses Series, TeeConst;

procedure TForm1.FormCreate(Sender: TObject);
begin
  Chart1.Title.Text.Text:=TeeMsg_Version;
  Chart1.View3D:=false;

  with Chart1.AddSeries(TBarSeries) as TBarSeries do
  begin
    FillSampleValues();

    BarWidthPercent:=100;
  end;
end;
Re: THistogramSeries % Bar Width
Posted: Wed May 04, 2016 1:31 pm
by 16575285
Yeray,
Yes, I get the same, but see what happens when you zoom in. The bar width in pixels seems to remain unchanged, so then fills less than 100% of the gap between the adjacent bars either side. When you have a lot of points and zoom in a long way to the detail, the effect is at its worst. That's what I need to correct. Is there a combination of properties that would do that? Or is it a bug?
Regards
Toreba.
Re: THistogramSeries % Bar Width
Posted: Thu May 05, 2016 9:07 am
by yeray
Hello Toreba,
Adding this, the BarWidthPercent property works better when zooming also:
Re: THistogramSeries % Bar Width
Posted: Wed Aug 24, 2016 11:39 am
by 16569674
We experience a similar problem for TBarSeries where the bar widths are not aligned according to the preset
BarWidthPercent when the x-axis is not set to automatic, i.e. does not show all existing values in the series. See the image below.
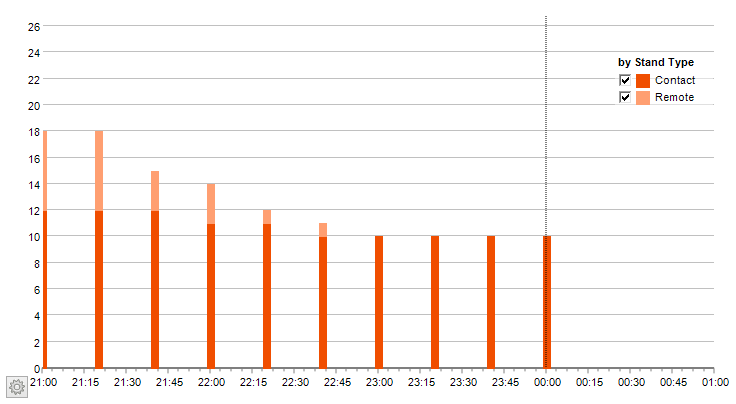
- wrong.png (9.83 KiB) Viewed 19673 times
The settings are:
- BarWidthPercent set to 70%
- Bottom Axis with manual Minimum/Maximum, i.e. non-automatic mode. The intention is to display the values with respect to the current time (illustrated by the vertical ColorLineTool), i.e. it is a "moving window" where the axis bounds are frequently updated to focus the current time.
What we would expect is a result as shown below:
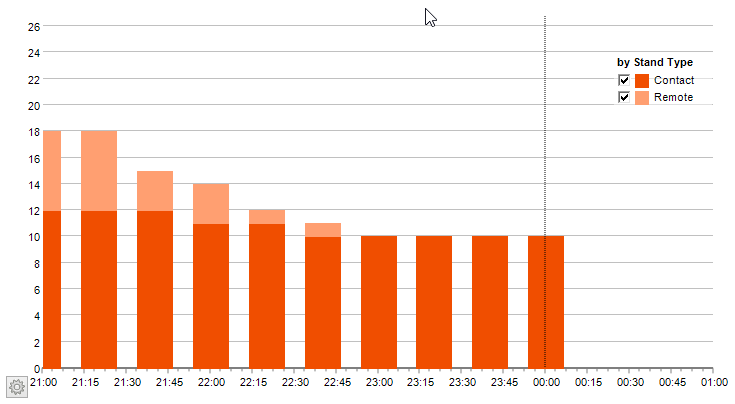
- working.png (10.16 KiB) Viewed 19673 times
We achieved this by adding some code to TBarSeries.DoBeforeDrawChart (I omitted some local procedures to make it easier readable):
Code: Select all
Procedure TCustomBarSeries.DoBeforeDrawChart;
var t    : Integer;
    Stop : Boolean;
    tmp  : Integer;
    tmpNonMandatoryAxisRange : Double;
    tmpValueStepPerBar: Double;
const cstAutoCalcBarPointsByBarSteps = True;
begin
  inherited;

  IBarSize:=0;
  IOrderPos:=1;
  IPreviousCount:=0;
  INumBars:=0;
  IMaxBarPoints:=TeeAllValues;
  Groups:=nil;
  Stop:=False;

  With ParentChart do
  for t:=0 to SeriesCount-1 do
  if Series[t].Active then
  begin
    if SameClass(Series[t]) and SameMandatoryAxis(Series[t]) then
    begin
      Stop:=Stop or (Series[t]=Self);
      tmp:=Series[t].Count;

      // ARC ///////////////////////////////////////////////////////////////////
      // Calculate "visible" Bar Points based on their "step width" between two bars compared to visible axis range
      if cstAutoCalcBarPointsByBarSteps and (NotMandatoryAxis.Automatic=False) then
      begin
        tmpNonMandatoryAxisRange:=NotMandatoryAxis.Maximum-NotMandatoryAxis.Minimum;
        if (tmp>1) and (tmpNonMandatoryAxisRange>0) then
        begin
          tmpValueStepPerBar:=Series[t].NotMandatoryValueList.Range/(tmp-1); // -1 since we want the step BETWEEN two bars
          tmp:=Round(tmpNonMandatoryAxisRange/tmpValueStepPerBar)+1; // +1 since the last bar also requires space
        end;
      end;
      //////////////////////////////////////////////////////////////////////////

      if (IMaxBarPoints=TeeAllValues) or (tmp>IMaxBarPoints) then
      begin
        IMaxBarPoints:=tmp;

        if FSideMargins and (tmp>0) then
           Inc(IMaxBarPoints);
      end;

      Case FMultiBar of
        mbNone: INumBars:=1;
        mbSide,
        mbSideAll,
        mbSelfStack:
                   begin
                     Inc(INumBars);
                     if not Stop then Inc(IOrderPos);
                   end;
        mbStacked,
        mbStacked100: if NewGroup(TCustomBarSeries(Series[t]).FStackGroup) then
                      begin
                        Inc(INumBars);
                        if not Stop then Inc(IOrderPos);
                      end;
      end;

      if not Stop then
         Inc(IPreviousCount,tmp);
    end;
  end;

  for t:=0 to Length(Groups)-1 do
  if Groups[t]=FStackGroup then
  begin
    IOrderPos:=t+1;
    break;
  end;

  Groups:=nil;

  if INumBars=0 then
     INumBars:=1;

  { this should be after calculating INumBars }
  if FMultiBar=mbSelfStack then
     if ParentChart.MaxPointsPerPage=0 then
        IMaxBarPoints:=INumBars
     else
        IMaxBarPoints:=ParentChart.MaxPointsPerPage

  else
  if ParentChart.MaxPointsPerPage>0 then
     IMaxBarPoints:=ParentChart.MaxPointsPerPage;

  if (ParentChart.MaxPointsPerPage>0) and FSideMargins and (IMaxBarPoints>0) then
     Inc(IMaxBarPoints);
end;
We would appreciate if this or a similar functionality could be integrated into the standard code to make it available for other users.
Kind regards,
Linus
PS: I also attached a simple demo project containing the example above:
Re: THistogramSeries % Bar Width
Posted: Fri Aug 26, 2016 10:17 am
by Marc
Hello Linus,
That looks useful, thank you for the contribution. We'll run a few checks and include it in the product code.
Thanks again.
Regards,
Marc Meumann
Re: THistogramSeries % Bar Width
Posted: Fri Aug 26, 2016 2:47 pm
by 16569674
Hello Marc,
thanks for the prompt and positive feedback. Happy to contribute - and after all, we're of course very interested to use the standard code base without having to merge any customisations of ours when installing a TeeChart update ...

Have a nice weekend,
Linus