Page 1 of 2
Changing the label of the axis ticks in event
Posted: Wed Feb 17, 2010 2:21 pm
by 10555193
I have found an event OnDrawAxisLabel on the Axis. This event returns the label that will be shown on the axis ticks. However this label is already formatted. For instance when the chart doesn't have enough room to display a full date and time it will only have a label with the date part even if the datetimeformat of the axis is set to "yyyy-mm-dd hh:mm:ss". Is there a way to access the actual value of the tick in this event that needs the label to make it possible for me to alter the labels at runtime?
Re: Changing the label of the axis ticks in event
Posted: Wed Feb 17, 2010 3:02 pm
by yeray
Hi Michael Heinrich,
I'm not sure to understand the exact situation. Could you please send us a simple example project we can run as-is to reproduce the problem here? Note that you can attach your files directly here in the forum posts.
Re: Changing the label of the axis ticks in event
Posted: Fri Feb 19, 2010 8:50 am
by 10555193
Hello Yeray,
I found out today that by using the increment on the axis I am able to exactly specify which ticks and therefore what labels are drawn on the axis. Using ExactDateTime gives me a correct label when using the TChartAxis.OnDrawLabel event that I can alter to show some extra information or alter the datetime into a dayname or a weeknumber of the year which I need for certain charts on the labels on the axis.
When I do not use the ExactDateTime and no increment I get labels that are slightly off making the labels on the axis appear random.
By always setting the TChartAxis.datetimeformat to a full date and full time I am able to manually convert labels on the axis to the correct labels.
However I believe it would be much easier if the TChartAxis.OnDrawLabel would return the actual value (float value of the tick when there are float values available) if possible.
Re: Changing the label of the axis ticks in event
Posted: Fri Feb 19, 2010 4:04 pm
by yeray
Hi Michael,
I'm still not sure to understand what are you exactly trying to do. As far as I can see that event seems to be giving the string that is going to be drawn in the ticks, not a float. Here is an example that seems to work as expected both with XValues.DateTime:=true; and XValues.DateTime:=false;
Code: Select all
  private
    procedure OnDrawAxisLabel(Sender:TChartAxis; var X,Y,Z:Integer; var Text:String; var DrawLabel:Boolean);

  //...

uses series;

procedure TForm1.FormCreate(Sender: TObject);
begin
  with Chart1.AddSeries(TBarSeries.Create(self)) do
  begin
    XValues.DateTime:=true;
    FillSampleValues(5);
  end;

  Chart1.Axes.Bottom.DateTimeFormat:='yyyy-mm-dd';
  Chart1.Axes.Bottom.OnDrawLabel:=OnDrawAxisLabel;
end;

procedure TForm1.OnDrawAxisLabel(Sender:TChartAxis; var X,Y,Z:Integer; var Text:String; var DrawLabel:Boolean);
begin
  if (Sender = Chart1.Axes.Bottom) then ShowMessage(Text);
end;
If you are still having problems with it, please try to modify the code above so that we can reproduce your situation here. Or send us a simple example project we can run as-is to reproduce the problem here.
Re: Changing the label of the axis ticks in event
Posted: Mon Feb 22, 2010 9:43 am
by 10555193
Hello Yeray,
The only thing I had hoped for that I could have a procedure like OnDrawAxisLabel(Sender:TChartAxis; var X,Y,Z:Integer; var Text:String; var DrawLabel:Boolean) but with
Code: Select all
procedure OnDrawAxisLabel(Sender:TChartAxis;
                                          var X,Y,Z:Integer;
                                          var Text: string;
                                          const aValueOfTick: Float;
                                          var DrawLabel:Boolean);
This will make it easier for me than converting a string to a float or a datestring to a float. I know that not all series have a value of a tick but those axis that have this information it would be much faster and easier to rearrange labels.
Thanks for the information but I have managed to make it work even if it is a little slow.
Michael.
Re: Changing the label of the axis ticks in event
Posted: Wed Feb 24, 2010 1:12 pm
by yeray
Hi Michael,
I've added it to the wish list to be considered for inclusion in future releases (TV52014696)
Re: Changing the label of the axis ticks in event
Posted: Fri Aug 14, 2015 1:28 pm
by 16569674
Hello,
is there any news on this subject? We have a similar issue where having the value information delivered with the OnDrawAxisLabel callback would be really helpful:
We frequently display time values (in the sense of a period of time, or a duration) in a chart, such as a delay. See the image below for an example.
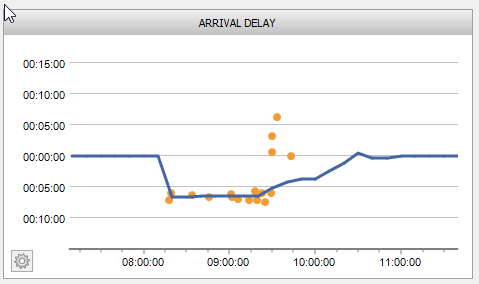
- Delay Example.png (9.64 KiB) Viewed 23398 times
As you see, the delay values can obviously also get negative. Unfortunately, the left axis displays the negative times in the same way as positive ones and we have not found any way to change or customise this behaviour.
I was hoping to be able to solve this using the OnDrawAxisLabel callback, but without the tick value I have no clue on how to achieve that.
Thanks for your feedback,
Linus
Re: Changing the label of the axis ticks in event
Posted: Fri Aug 14, 2015 1:51 pm
by narcis
Hi Linus,
You can get labels values at
OnGetAxisLabel event. Having that in mind you can achieve what you request doing something like this:
Code: Select all
uses
  Series;

procedure TForm1.FormCreate(Sender: TObject);
var i: Integer;
begin
  Chart1.View3D:=False;

  Chart1.AddSeries(TLineSeries.Create(Self));
  Chart1[0].YValues.DateTime:=True;

  for i:=0 to 10 do
  begin
    Chart1[0].Add(i-4.5);
  end;
end;

procedure TForm1.Chart1GetAxisLabel(Sender: TChartAxis;
  Series: TChartSeries; ValueIndex: Integer; var LabelText: String);
var
  tmpDateTime : TDateTime;
begin
  if Sender = Chart1.Axes.Left then
  begin
    tmpDateTime:=StrToDate(LabelText);

    if tmpDateTime < 0 then
      LabelText:='-'+LabelText;
  end;
end;
Re: Changing the label of the axis ticks in event
Posted: Fri Aug 14, 2015 3:30 pm
by 16569674
Hi Narcis,
thanks for your prompt answer. The problem of course is that when the initial LabelText denotes a positive value (as in my screenshot), the temp conversion into a TDatetime won't help.
Even when adjusting the DateTimeFormat of the left axis to a fully qualified Date/Time format (such as 'dd/MM/yyyy hh:mm:ss'), it won't properly work, at least for values between -1 and 0. I realise that the problem originates from Delphi's DateTimeToString function.
In case changing the existing callback is problematic due to compatibility reasons, an alternative might be to provide an additional one, such as shown below?
Code: Select all
Function TChartAxis.LabelValue(Const Value:Double):String;
var tmp : String;
Begin
  ///////////////////////////////////////////////////////////////
  if Assigned(ParentChart.FOnGetCustomAxisLabel) then
     Result := ParentChart.FOnGetCustomAxisLabel(TChartAxis(Self), Value)
  ///////////////////////////////////////////////////////////////
  else
  begin
  if IAxisDateTime then
  begin
    if FDateTimeFormat='' then tmp:=DateTimeDefaultFormat(IRange)
                          else tmp:=FDateTimeFormat;

    DateTimeToString(result,tmp,Value);
  end
  else
    result:=FormatFloat(FAxisValuesFormat,Value);

  if Assigned(ParentChart.FOnGetAxisLabel) then
     ParentChart.FOnGetAxisLabel(TChartAxis(Self),nil,-1,Result);

  if FLabels.MultiLine then
     result:=ReplaceChar(result,' ',TeeLineSeparator);
  end;
end;
Thanks and have a nice weekend,
Linus
Re: Changing the label of the axis ticks in event
Posted: Tue Aug 18, 2015 11:01 am
by yeray
Hello,
Yeray wrote:
I've added it to the wish list to be considered for inclusion in future releases (TV52014696)
I've moved the ticket to the public tracker:
http://bugs.teechart.net/show_bug.cgi?id=1274
Now you can add your mail to the CC list to be automatically notified if an update arrives.
LNS wrote:I realise that the problem originates from Delphi's DateTimeToString function.
While the ticket is open, in your case you could try a different approach.
If I understand it correctly you are loading the delays as a TDateTime in the YValues of the series. Instead, the YValues on your series could be a double indicating the delay in seconds (ie -5*60 for a flight arrived 5min before its scheduled time, or 1*60 for a flight arrived a minute late). This way, the strings you get at OnGetAxisLabel would be the number of seconds delayed - including the negative sign where applies - and you would be able to easily convert that number of seconds to "+/- hh:mm:ss".
Re: Changing the label of the axis ticks in event
Posted: Tue Aug 18, 2015 12:07 pm
by 16569674
Thanks Yeray,
that sound like a good approach, at least for a static chart. We are developing an analysis suite for our simulation tools where charts are built dynamically and may contain multiple series, some of them date/time (or duration such as the "delay" I mentioned), some others displaying standard numeric values. A specific handling of "duration" values including a transformation of the series values will probably make life pretty hard in that environment, so we'll leave it as it is for now and hope the callback enhancement will be included in a new release soon ...

Re: Changing the label of the axis ticks in event
Posted: Wed Aug 19, 2015 9:09 am
by yeray
Hello,
I've incremented the "importance" of the ticket but I can't say when it will be closed.
I'd insist on suggesting you to prepare the data before populating the series rather than modifying values in the middle of the drawing process.
Re: Changing the label of the axis ticks in event
Posted: Wed Aug 19, 2015 9:30 am
by 16569674
Hi Yeray,
thanks for bumping up the importance of the ticket!
I fully agree that the data should be translated to seconds before populating the series. What I meant with "specific handling for those duration series" is that we need to
- Prepare the data by translating to seconds [OK, not a major problem]
- Ensure that those series are attached to the corresponding axis (i.e. they do not share the left axis with other series that are in "normal numeric" mode) and that this axis customises the labels as you suggested
- Have the values in this "custom" unit instead of the usual TDateTime unit (1.0 = 1 day). This complicates things when it comes to exporting data or showing it in a table etc.
These are the reasons why I would prefer to wait for a solution in terms of an extended callback. As a last resort, we can of course also customise the source code, but we would of course prefer to leave it untouched.
Re: Changing the label of the axis ticks in event
Posted: Thu Aug 20, 2015 2:41 pm
by yeray
Hello,
I'm not sure to understand the last two.
I'll be pleased to take a look at a simple example project showing those issues if you can arrange it.
Re: Changing the label of the axis ticks in event
Posted: Fri Aug 21, 2015 6:27 am
by 16569674
Hi Yeray,
what the user is able to do within our engine is to generate charts on a data set using "series generation blocks" that serve specific purposes (e.g. aggregating events (TDateTime timestamps) over time applying a rolling hour calculation). Those blocks dynamically create series-based data that is then being translated into TChart Series and is being displayed on a connected chart. Since such a connected chart can be fed by multiple of those blocks, the series being displayed can be of varying type and esp. y-axis datatype (float or TDateTime as specified by Series.YValues.DateTime).
What we do is:
- Generate the TChartseries
- forward it to the Chart
- assigning a y-axis (left or right), depending on the other series and their y-axis types in the chart. If there are only series of the same y-axis type in the chart, they area assigned to the left axis. If there are differing y-axis types present, the numeric ones are assigned to the left axis and the TDateTime ones to the right axis.
Once we treat the "Duration" values as simple numeric values (Series.YValues.DateTime = false), we cannot determine based on the TChartSeries if it is to be assigned to a special "Duration in Seconds" axis.
To illustrate the third point, imagine a TDataTableTool attached to the chart. We'd like to show the "Duration" values in the usual time format (hh:mm:ss) there too, but once they translated to seconds, we won't be able to do that without additional effort.