Page 1 of 1
3D Pie chart using teechart with three.js WebGL™ 3D
Posted: Mon Sep 19, 2016 9:25 am
by 15677821
Hi,
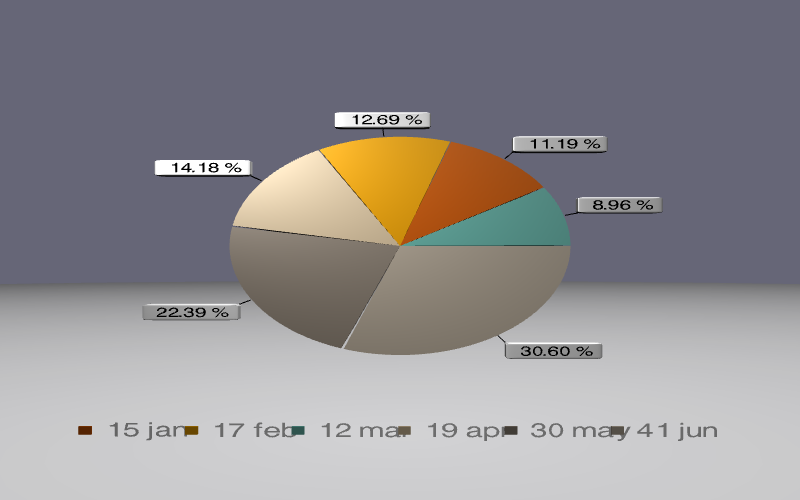
I have created 3D pie chart using three.js WebGL. But my pie chart does not looks as i expected. I have attached my working copy and expected pie chart image in below attachment.
And please provide appropriate sample code for 3D pie chart for my expected pie chart image as i have attached here.
Re: Export as HTML5 JScript
Posted: Mon Sep 19, 2016 10:58 am
by yeray
Hello,
SenSeo wrote:I have created 3D pie chart using three.js WebGL. But my pie chart does not looks as i expected. I have attached my working copy and expected pie chart image in below attachment.
And please provide appropriate sample code for 3D pie chart for my expected pie chart image as i have attached here.
I'm not sure if this has any relation with the opening question in this thread. If not, I'll split it into a new thread.
This is what I'm getting with your code example:
- chrome_2016-09-19_12-57-40.png (58.4 KiB) Viewed 16896 times
Could you please explain what didn't you expect from it?
Re: 3D Pie chart using teechart with three.js WebGL™ 3D
Posted: Tue Sep 20, 2016 3:48 am
by 15677821
Hello,
This question is not relevant to Export as HTML5 JScript. Please split it into a new thread.
I have attached my expected 3D pie chart image for your reference. Please provide sample code for this attached 3D pie chart image with right alignment legend.
Re: 3D Pie chart using teechart with three.js WebGL™ 3D
Posted: Tue Sep 20, 2016 11:02 am
by yeray
Hello,
Using this code:
Code: Select all
var three, Chart1;

function draw() {

    three = new Tee.Three("canvas1");
    Chart1 = new Tee.Chart(three);

    var pie1 = new Tee.Pie();
    pie1.title = "Apples";
    pie1.data.values = [15, 17, 12, 19, 30, 41];
    pie1.data.labels = ["jan", "feb", "mar", "apr", "may", "jun"];
    pie1.marks.style = "label";
    pie1.marks.transparent=true;

    Chart1.addSeries(pie1);

    three.floor.visible = false;
    three.renderer.setClearColor( 0xffffff );
    Chart1.title.visible = false;

    Chart1.legend.position = "right";

    if (three.isEnabled()) {
        changeTheme(Chart1, "minimal");
        Chart1.draw();
        animate();
    }
    else {
        // Show message (WebGL not available) :
        Detector.addGetWebGLMessage();

        // Disable WebGL and use HTML5 2D Canvas:
        three.setEnabled(false, Chart1);
    }

    // Loop
    function animate() {
        three.update();
        requestAnimationFrame(animate);
    }
}
I get this:
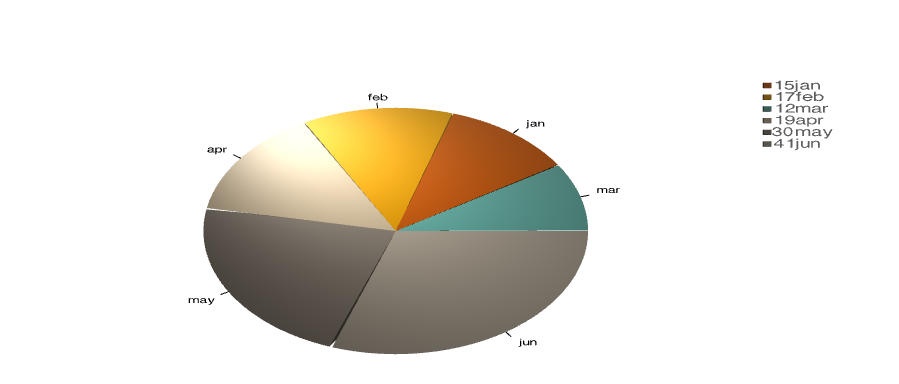
- chrome_2016-09-20_13-02-08.png (57.62 KiB) Viewed 16875 times
Re: 3D Pie chart using teechart with three.js WebGL™ 3D
Posted: Wed Sep 21, 2016 1:31 pm
by 15677821
Hello,
Is there any posibility to generate 3D pie chart as attached image(3D Pie chart).?
My requirment is 1.Chart title on top 2.Legend in right side 3.Tooltip with proper alignment 4. 3D pie chart with attached image view
Re: 3D Pie chart using teechart with three.js WebGL™ 3D
Posted: Thu Sep 22, 2016 8:47 am
by yeray
Hello,
SenSeo wrote:1.Chart title on top
Removing this line of code in the code I posted above makes the title to appear:
SenSeo wrote:2.Legend in right side
The legend is already in the right side in the chart I attached in my last post.
SenSeo wrote:3.Tooltip with proper alignment
Do you mean the series marks? We use call Tooltip to a text appearing when the user moves the mouse over a series.
Feel free to override the drawMarks function to do what you want. Ie, override it leaving it as it is:
Code: Select all
    pie1.drawMarks=function() {
        var endAngle=Math.PI*this.rotation/180.0, angle=endAngle, mid,
                v=this.data.values, len=v.length, index, t,
                center={x:0,y:0}, r=new Rectangle(), total=ArraySumAbs(this.data.values),
                sorted=this.doSort(this.sort, this.orderAscending), f=this.format;

        var h=0, m=this.marks;

        if (f.shadow.visible)
            h+=2*f.shadow.height;

        if (m.visible) {
            m.format.font.prepare();
            h+=m.format.textHeight("Wj")+m.arrow.length*0.5;
        }

        this.cellRect(r,!this.concentric, Tee.Pie);
        var radius = r.width*0.5;
        var r2=(r.height-2*h)*0.5;
        if (r2<0) r2=0;
        if (r2<radius) radius=r2;

        var piex=r.x+(r.width*0.5);
        var piey=r.y+(r.height*0.5);

        this.marks.format.z = 0.5;

        for(t=0; t<len; t+=this.marks.drawEvery) {

            index= sorted ? sorted[t] : t;

            if (!this.isNull(index)) {
                endAngle+=Math.PI*2*(Math.abs(v[index]) /total);
                mid=(angle+endAngle)*0.5;
                center.x=piex;
                center.y=piey;
                this.calcCenter(t,radius,mid,center);
                this.marks.drawPolar(center, radius, mid , index);
                angle=endAngle;
            }
        }
    }
SenSeo wrote:4. 3D pie chart with attached image view
The view you attached looks like a 3D Chart in TeeChart VCL/NET/ActiveX where the perspective is drawn calculating the polygons internally. These 3D effects are good enough for the majority of cases, but can give wrong results in a few situations. Ie:
http://bugs.teechart.net/show_bug.cgi?id=935
http://bugs.teechart.net/show_bug.cgi?id=939
In TeeChart Javascript we haven't implemented these 3D effects for the moment. Instead of this, as you've observed, we are using WebGL for the 3D, that gives a similar result to OpenGL in the other TeeChart versions.