Page 1 of 1
onGetLabel with fractions
Posted: Mon May 26, 2014 2:39 pm
by 17768801
Hi,
I add 3 points to simple line serie with X coordinates: 1, 1.5 and 2. Then I try to use onGetLabel to edit labels, but it seems that it doesn't fire for 1.5. Is it normal? If it is, how can I add custom label for point 1.5?
Re: onGetLabel with fractions
Posted: Tue May 27, 2014 1:29 pm
by yeray
Hello,
I've tried this and the axis label at 1.5 seems to be correctly caught:
Code: Select all
  Chart1=new Tee.Chart("canvas1");

  var s = Chart1.addSeries(new Tee.Line(Chart1));
  s.data.x=[1,1.5,2];
  s.data.values=[1,2,2.5];

  Chart1.axes.bottom.increment=0.5;
  Chart1.axes.bottom.setMinMax(0.95, 2.05);

  Chart1.axes.bottom.labels.ongetlabel=function(value,s) {
    if (value==1.5) {
       this.format.font.fill="red";
       this.format.font.style="14px Verdana";
       return "OneDotFive";
    }
    else {
       this.format.font.fill="black";
       this.format.font.style="11px Tahoma";
       return s;
    }
  }

  Chart1.draw();
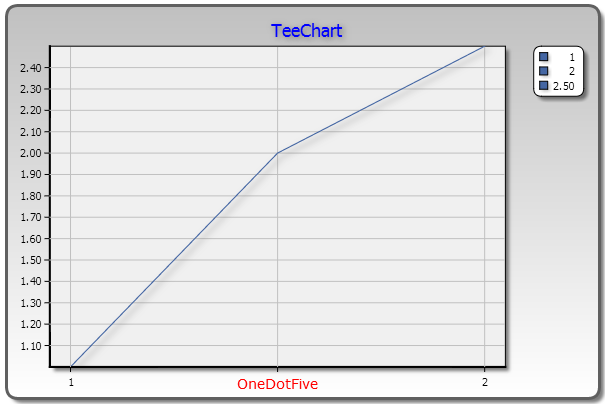
- 2014-05-27_1528.png (27.63 KiB) Viewed 8985 times
Are you using the latest TeeChart for JavaScript version?
Re: onGetLabel with fractions
Posted: Tue May 27, 2014 2:19 pm
by 17768801
The magic line was:
Now it works! Thank you for help!
Re: onGetLabel with fractions
Posted: Thu May 29, 2014 12:57 pm
by 17768801
I still don't get it. If I add point 1.7 to the line, it doesn't work for it. Setting Chart1.axes.bottom.increment to 0.1 doesn't help. Could you explain how onGetLabel works?
Re: onGetLabel with fractions
Posted: Thu May 29, 2014 1:47 pm
by yeray
Hi Igor,
Debugging, I've seen the
ongetlabel event was being fired, but
value was 1.7000000000000006, not 1.7.
Changing the condition for this, it works fine for me:
Code: Select all
  Chart1=new Tee.Chart("canvas1");

  var s = Chart1.addSeries(new Tee.Line(Chart1));
  s.data.x=[1,1.5,1.7,2];
  s.data.values=[1,2.5,2,2];

  Chart1.axes.bottom.increment=0.1;
  Chart1.axes.bottom.setMinMax(0.95, 2.05);

  Chart1.axes.bottom.labels.ongetlabel=function(value,s) {
    var v=value.toFixed(trunc(value)==value ? 0 : this.decimals);
    if ((v==1.5) || (v==1.7)) {
       this.format.font.fill="red";
       this.format.font.style="14px Verdana";
       return s;
    }
    else {
       this.format.font.fill="black";
       this.format.font.style="11px Tahoma";
       return s;
    }
  }

  Chart1.draw();