Page 1 of 1

Different gradients for different bars?

Posted: Mon Mar 18, 2013 9:55 pm
by 17064597
You can easily get a specific gradient for all bars in a Bar chart. However, what if you want different gradients for each bar in the Bar chart?

Code: Select all

Bar bar = new Bar(chart.getChart());
bar.getColors().setColor(0, red);
bar.getColors().setColor(1, blue);
bar.add(0, 123, "Red");
bar.add(0, 123, "Blue");
Red and blue. Nice! Now, how about two gradients for the two?

Re: Different gradients for different bars?

Posted: Tue Mar 19, 2013 2:50 pm
by yeray
Hi,

I showed you an example where different gradients where set to the bar values:
http://www.teechart.net/support/viewtop ... 909#p61033

And some posts later I've posted an improved version:
http://www.teechart.net/support/viewtop ... 909#p61078

What's the problem with these examples?

Re: Different gradients for different bars?

Posted: Tue Mar 19, 2013 8:03 pm
by 17064597
In that post I asked for the opposite; the same gradient for all bars.

Now I'm asking for different gradients for different bars (obviously in the same Bar class instance). Please see attached image.

Re: Different gradients for different bars?

Posted: Wed Mar 20, 2013 8:48 am
by yeray
Hi Kristoffer,
znakeeye wrote:In that post I asked for the opposite; the same gradient for all bars.

Now I'm asking for different gradients for different bars (obviously in the same Bar class instance). Please see attached image.
In the mentioned reply, where we are trying to set a gradient relative to an "external" maximum. This sounds as having the same gradient, but the solution suggested actually modifies the 2 of the 3 colors of the canvas gradient each time a bar is going to be drawn. So that solution should be flexible enough to cover any desired gradient.

Another, maybe simpler, solution for this case, would be to add a Bar series for each gradient type you want to show. In the image you've attached, you could have 3 Bar series with a value for each one. Then, you could set your gradient for each series. Just note that with this solution you'll have to add the values with XValue, otherwise, having three Bars with just a value will end on three values at XValue=0.

Re: Different gradients for different bars?

Posted: Wed Mar 20, 2013 8:12 pm
by 17064597
Thanks for clarification! I'll try this multi-bar approach.
Actually, I did try this in your sample app but that results in Series0 becoming invisible when using gradients on the two series.
Not sure if this is a bug in the sample app or in the core functions. I'll get back to you when I've tried your approach in my app :)

Re: Different gradients for different bars?

Posted: Fri Mar 22, 2013 5:02 pm
by 17064597
"Just note that with this solution you'll have to add the values with XValue, otherwise, having three Bars with just a value will end on three values at XValue=0."

Do you mean that you have to add values for x=0, x=1, x=2 for each bar? I see that values are added at index 0 even if I add x=1 or x=2. The reason is ValueList.java(512):

Code: Select all

result = count;
incrementArray();
this.value[result] = value;
count equals 0. Hence, all bars end up at position 0. Is this by design?

Re: Different gradients for different bars?

Posted: Mon Mar 25, 2013 11:15 am
by yeray
Hi Kristoffer,
znakeeye wrote:Actually, I did try this in your sample app but that results in Series0 becoming invisible when using gradients on the two series.
Not sure if this is a bug in the sample app or in the core functions. I'll get back to you when I've tried your approach in my app :)
Please, try to arrange a simple example project we can run as-is to reproduce the problem here.
znakeeye wrote:
yeray wrote:Just note that with this solution you'll have to add the values with XValue, otherwise, having three Bars with just a value will end on three values at XValue=0.
Do you mean that you have to add values for x=0, x=1, x=2 for each bar? I see that values are added at index 0 even if I add x=1 or x=2. The reason is ValueList.java(512):
I meant you could create 3 instances of the Bar series class (bar1, bar2, bar3), define the gradients of each them, and add a unique point for each. Something like this:

Code: Select all

		tChart1.getAspect().setView3D(false);
		tChart1.getLegend().setVisible(false);
		  
		Bar bar1 = new Bar(tChart1.getChart());
		bar1.getPen().setVisible(false);
		bar1.getMarks().setVisible(false);
		bar1.getGradient().setVisible(true);
		bar1.getGradient().setUseMiddle(false);
		bar1.getGradient().setEndColor(Color.fromArgb(205, 224, 242));
		bar1.getGradient().setStartColor(Color.red);
		
		Bar bar2 = new Bar(tChart1.getChart());
		bar2.getPen().setVisible(false);
		bar2.getMarks().setVisible(false);
		bar2.getGradient().setVisible(true);
		bar2.getGradient().setUseMiddle(false);
		bar2.getGradient().setEndColor(Color.fromArgb(205, 224, 242));
		bar2.getGradient().setStartColor(Color.fromArgb(170, 210, 145));
		
		Bar bar3 = new Bar(tChart1.getChart());
		bar3.getPen().setVisible(false);
		bar3.getMarks().setVisible(false);
		bar3.getGradient().setVisible(true);
		bar3.getGradient().setUseMiddle(false);
		bar3.getGradient().setEndColor(Color.fromArgb(205, 224, 242));
		bar3.getGradient().setStartColor(Color.yellow);
		
		bar1.add(0, 20, "A");
		bar2.add(1, 40, "B");
		bar3.add(2, 30, "C");
This would let you define the colors without having to handle any event. But we have then a problem with the bottom axis labels:
first.png
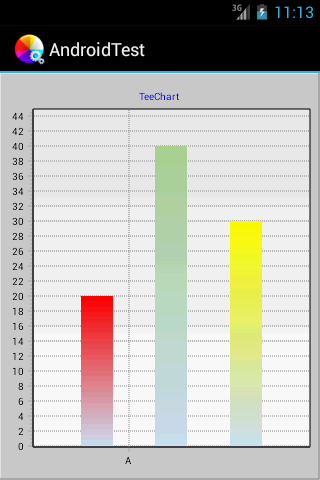
first.png (10.06 KiB) Viewed 14801 times
So I'd better rectify my suggestion: I'd continue using a unique Bar series with three points in it, and using the BarStyleResolver event to modify the gradients:

Code: Select all

		tChart1.getAspect().setView3D(false);
		tChart1.getLegend().setVisible(false);
		  
		Bar bar1 = new Bar(tChart1.getChart());
		
		bar1.getPen().setVisible(false);
		bar1.getMarks().setVisible(false);
		bar1.getGradient().setVisible(true);
		bar1.getGradient().setUseMiddle(false);
		bar1.getGradient().setEndColor(Color.fromArgb(205, 224, 242));
		
		bar1.add(20, "A", Color.red);
		bar1.add(40, "B", Color.fromArgb(170, 210, 145));
		bar1.add(30, "C", Color.yellow);
		
		bar1.setBarStyleResolver(new BarStyleResolver() {
			
			@Override
			public BarStyle getStyle(ISeries series, int valueIndex, BarStyle style) {
				if (series!=null) {
		               if (valueIndex > -1) {
		            	   tChart1.getGraphics3D().getGradient().setStartColor(series.getValueColor(valueIndex));
		               }
				}
				return style;
			}
		});
		
		tChart1.getAxes().getLeft().setMinMax(0, 45);
second.png
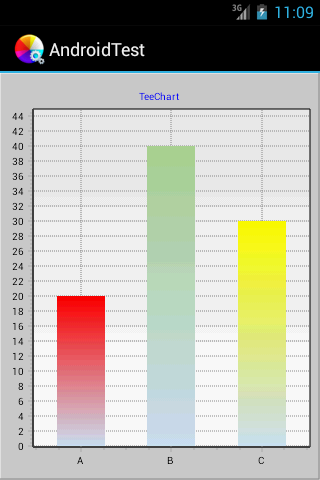
second.png (10.83 KiB) Viewed 14808 times