Page 1 of 1
Axis color
Posted: Sun Feb 17, 2013 12:29 am
by 16959570
I have set as many backgrounds as i could find to black; but I can't find how to set the Axis text to white.
Please advise.
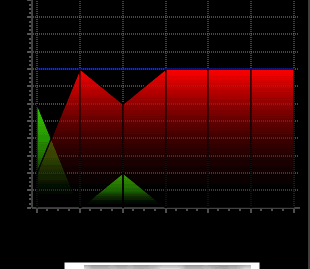
- oops.png (4.6 KiB) Viewed 15119 times
Code:
Code: Select all
tchart.getPanel().setTransparent(false);
tchart.getPanel().setColor(Color.BLACK);
tchart.getWalls().getBack().setColor(Color.BLACK);
tchart.getWalls().getBack().getGradient().setVisible(false);
tchart.getZoom().setZoomStyle( ZoomStyle.FULLCHART);
Re: Axis color
Posted: Mon Feb 18, 2013 9:05 am
by yeray
Hi Dave,
Try this to set the axes labels colors:
Code: Select all
tchart.getAxes().getLeft().getLabels().getFont().setColor(Color.WHITE);
tchart.getAxes().getBottom().getLabels().getFont().setColor(Color.WHITE);
Re: Axis color
Posted: Mon Feb 18, 2013 8:52 pm
by 16959570
Thanks, Yeray.
Is there a way to remove the black lines from the area chart, and how can I change the look of the background grid?
Thanks
Dave
Re: Axis color
Posted: Tue Feb 19, 2013 10:43 am
by yeray
Hi Dave,
DaveSav wrote:Is there a way to remove the black lines from the area chart
Being area1 an instance of the Area class, to hide the area lines:
Code: Select all
area1.getAreaLines().setVisible(false);
DaveSav wrote:how can I change the look of the background grid?
You can personalize the Axes Grid Pens like, ie:
Code: Select all
tChart1.getAxes().getLeft().getGrid().setStyle(DashStyle.DOT);
tChart1.getAxes().getBottom().getGrid().setVisible(false);
Re: Axis color
Posted: Tue Feb 19, 2013 10:01 pm
by 16959570
Thanks Yeray,
It looks like I've set up my Area chart incorrectly:
Code: Select all
Series ln = new Area(tchart.getChart());
((Area)ln).getAreaLines().setVisible(false);
((CustomPoint)ln).setStacked(CustomStack.NONE);

[do a loop here]
DateTime dt = new DateTime(blah,blah,blah);
ln.add(dt, double(DurationData.get(i).getDuration /60 /60));
[end loop]
It seems to work ok, but would be nice to instantiate it correctly.
Dave
Re: Axis color
Posted: Tue Feb 19, 2013 11:20 pm
by 16959570
Now I'm not sure that Area is what I want. Is there a way to shade below the lines of a line chart?
Re: Axis color
Posted: Wed Feb 20, 2013 8:13 am
by yeray
Hi Dave,
I'm not sure to understand what you mean. Could you please explain it with more details? Adding some image may help too.
Re: Axis color
Posted: Wed Feb 20, 2013 8:55 pm
by 16959570
Before buying TeeChart, I was using aChartEngine, and you could add a transparent shading below each series line, as in the image below.
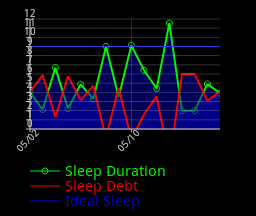
- achart.png (51.31 KiB) Viewed 15055 times
Thanks
Dave
Re: Axis color
Posted: Fri Feb 22, 2013 1:12 pm
by yeray
Hi Dave,
You can set the transparency to the Area series as here:
Code: Select all
	    	  Area area1 = new Area(tChart1.getChart());
	    	  area1.fillSampleValues();
	    	  area1.getAreaLines().setVisible(false);
	    	  area1.setTransparency(50);
Or something more similar to your image, with wider lines, blue transparent areas, pointer visible for one of them...
Code: Select all
	    	  for (int i=0; i<2; i++) {
	    		  Area area = new Area(tChart1.getChart());
		    	  area.fillSampleValues();
		    	  area.getLinePen().setWidth(2);
		    	  area.getLinePen().setColor(Theme.OnBlackPalette[i]);
		    	  area.setColor(Color.BLUE);
		    	  area.getAreaLines().setVisible(false);
		    	  area.setTransparency(80);
		    	  if (i==0) {
		    		  area.getPointer().setVisible(true);
		    		  area.getPointer().setStyle(PointerStyle.CIRCLE);
		    		  area.getPointer().getBrush().setSolid(false);
		    		  area.getPointer().getPen().setColor(area.getLinePen().getColor());
		    	  }
	    	  }