Page 1 of 1
Color areas in line chart
Posted: Fri Sep 28, 2012 9:46 am
by 17463568
Hello
I'm a developer in a factory of PP films (used for packaging e.g. chips, cigarettes, ...) Produced film coming out from extrusion has thickness between 3 and 100 micrometers and it's very important to see quality of film (here the thickness profile) every time. From a gauge system, I'm getting the thickness profile (about 400 values of thickness) and I have to display a chart like this one:
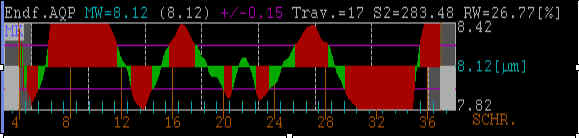
- chart.jpg (13.17 KiB) Viewed 20953 times
Important are the red areas which should indicate a region over the width of the film not being in specification.
How can I achieve this with TChart (Java) ? Areas must be red when the chart is crossing the two horizontal lines
Regards
Hubert
Re: Color areas in line chart
Posted: Fri Sep 28, 2012 12:22 pm
by yeray
Hi Hubert,
Yes, you can assign a color (red or green) to each point, relative to the point value.
Here you have an example:
Code: Select all
public class Test {

	static Display display;
	static Shell shell;
	static TChart tChart1;

	public static void main(String[] args) {
		display = new Display();
		shell = new Shell(display);
		shell.setLayout(new FillLayout());
		shell.setSize(600, 200);

		createChart();
		initializeChart();

		shell.open();
		while (!shell.isDisposed()) {
			if (!display.readAndDispatch()) {
				display.sleep();
			}
		}
		display.dispose();
	}

	private static void createChart() {
		tChart1 = new TChart(shell, 0);
	}

	private static void initializeChart() {
		tChart1.getHeader().setVisible(false);
		tChart1.getAspect().setView3D(false);
		tChart1.getLegend().setVisible(false);
		tChart1.getPanel().setColor(Color.BLACK);
		tChart1.getWalls().getBack().getGradient().setVisible(false);
		tChart1.getWalls().getBack().setColor(Color.BLACK);
		tChart1.getAxes().getLeft().getLabels().getFont().setColor(Color.WHITE);
		tChart1.getAxes().getBottom().getLabels().getFont().setColor(Color.WHITE);

		Area area1 = new Area(tChart1.getChart());
		area1.fillSampleValues(1000);
		area1.getAreaLines().setVisible(false);
		area1.setUseOrigin(true);
		area1.setOrigin(area1.getYValues().getMinimum() + (area1.getYValues().getRange()/2));

		ColorLine colorLine1 = new ColorLine(tChart1.getChart());
		ColorLine colorLine2 = new ColorLine(tChart1.getChart());
		colorLine1.setAxis(tChart1.getAxes().getLeft());
		colorLine2.setAxis(tChart1.getAxes().getLeft());
		colorLine1.setValue(area1.getYValues().getMinimum() + (area1.getYValues().getRange()/4));
		colorLine2.setValue(area1.getYValues().getMinimum() + (area1.getYValues().getRange()/4)*3);
		colorLine1.getPen().setColor(Color.PURPLE);
		colorLine2.getPen().setColor(Color.PURPLE);

		for(int i=0; i<area1.getCount(); i++) {
			if ((area1.getYValues().getValue(i) < colorLine1.getValue()) || (area1.getYValues().getValue(i) > colorLine2.getValue())
				|| ((i>0) && ((area1.getYValues().getValue(i-1) < colorLine1.getValue()) || (area1.getYValues().getValue(i-1) > colorLine2.getValue()))))
				area1.getColors().setColor(i, Color.RED);
			else
				area1.getColors().setColor(i, Color.GREEN);
		}
	}
}
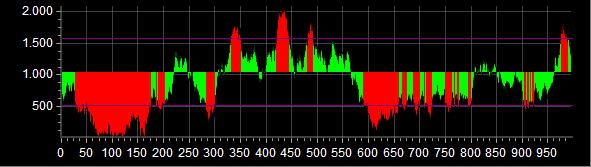
- Area.png (14.9 KiB) Viewed 20967 times
Re: Color areas in line chart
Posted: Fri Sep 28, 2012 12:48 pm
by 17463568
This is exactly what I need
... and so easy.
Sorry, I'm quite a bloody newbie
Re: Color areas in line chart
Posted: Fri Sep 28, 2012 1:41 pm
by yeray
Hi Hubert,
mora wrote:This is exactly what I need
... and so easy.
Sorry, I'm quite a bloody newbie
Don't worry! I'm glad to be helpful!
Anyway, I'd suggest you to take a look at the features demo. You'll find examples of the main features TeeChart supports, but also interesting tips "hidden" in the code.
Re: Color areas in line chart
Posted: Mon Oct 01, 2012 6:53 am
by 17463568
Thx again.
But now I have another problem.
I used your code and it works fine. But when I wants to use "smoothing" the chart is no more what I want.
In detail : when I use area.setSmoothed with parameter true or false the chart looks always like
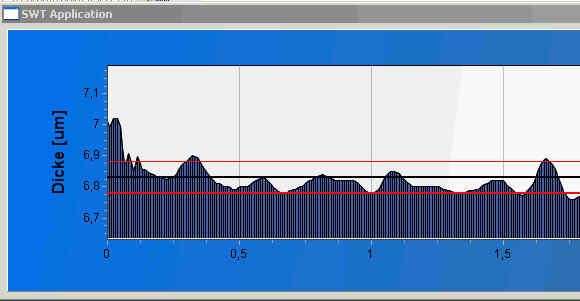
- chart.jpg (22.48 KiB) Viewed 20940 times
Parameter does not matter.
Is this a bug or normal behavior
Regards
Hubert
Re: Color areas in line chart
Posted: Mon Oct 01, 2012 8:52 am
by yeray
Hi Hubert,
The setSmoothed() function creates an internal series with new values calculated with an interpolation from the source series. And then this internal series is drawn and not the source series, so the colors you applied to the source series won't be shown.
To work around this, you could create the internal smoothed series manually, and assign the colors to its points:
Code: Select all
	private static void setSmoothed(Area area) {
		Custom smoothSeries = (Custom)area.clone();
        smoothSeries.getPointer().setVisible(false);
        smoothSeries.InternalUse = true;
        smoothSeries.setShowInLegend(false);
        Smoothing smoothFunction = new Smoothing(area.getChart());
        smoothFunction.InternalUse = true;
        smoothFunction.setInterpolate(true);
        smoothFunction.setFactor(8);
        smoothSeries.setFunction(smoothFunction);
        smoothSeries.setDataSource(area);
        if(area.getChart() != null) {
            for(int i=0; i < area.getChart().getTools().size(); i++) {
                if(area.getChart().getTools().getTool(i) instanceof ToolSeries) {
                	area.getChart().getSeries().exchange(area.getChart().getSeries().indexOf(area),
                			area.getChart().getSeries().indexOf(smoothSeries));
                }
            }
        }
        area.getLinePen().setVisible(false);
        area.getBrush().getGradient().setVisible(true);
        area.getBrush().setVisible(false);
        area.getAreaBrush().setVisible(false);
        area.getAreaLines().setVisible(false);

        double min = area.getYValues().getMinimum() + (area.getYValues().getRange()/4);
        double max = area.getYValues().getMinimum() + (area.getYValues().getRange()/4)*3;

        for(int i=0; i<smoothSeries.getCount(); i++) {
			if ((smoothSeries.getYValues().getValue(i) < min) || (smoothSeries.getYValues().getValue(i) > max)
				|| ((i>0) && ((smoothSeries.getYValues().getValue(i-1) < min) || (smoothSeries.getYValues().getValue(i-1) > max))))
				smoothSeries.getColors().setColor(i, Color.RED);
			else
				smoothSeries.getColors().setColor(i, Color.GREEN);
		}
	}
Re: Color areas in line chart
Posted: Fri Oct 12, 2012 9:16 am
by 17463568
Another problem is display different colors for texts in the header line.
Is there any other way than using direct GC calls to the chart canvas?
Re: Color areas in line chart
Posted: Mon Oct 15, 2012 9:48 am
by narcis
Hi Hubert,
Yes, you can do something like this:
Code: Select all
        tChart1.getHeader().setTransparent(false);
        tChart1.getHeader().setColor(java.awt.Color.blue);
        tChart1.getHeader().getFont().setColor(Color.red);
If this is not what you were looking for don't hesitate to let us know.
Re: Color areas in line chart
Posted: Tue Oct 16, 2012 9:22 am
by 17463568
Hi Narcis
no, is not what I want.
Pls see my first picture in this thread.
In the headerline there are some parts in white, other in blue or in red.
It should be something like a styledText where i can colour parts individually.
Thx
Hubert
Re: Color areas in line chart
Posted: Tue Oct 16, 2012 10:11 am
by narcis
Hi Hubert,
In that case you can use custom text drawing:
Code: Select all
        tChart1.getHeader().setVisible(false);
        tChart1.getPanel().setMarginTop(10);

        tChart1.addChartPaintListener( new ChartPaintAdapter() {
            @Override
            public void chartPainted(ChartDrawEvent pce) {
                IGraphics3D g = tChart1.getGraphics3D();
                Rectangle r = tChart1.getChart().getChartRect();
                g.getFont().setColor(Color.blue);
                String tmp = "My";
                g.textOut(r.getLeft(), 10, tmp);
                g.getFont().setColor(Color.red);
                tmp = "custom";
                int w = g.textWidth(tmp);
                g.textOut(r.getLeft() + w + 5, 10, tmp);
                g.getFont().setColor(Color.green);
                tmp = "text";
                w += g.textWidth(tmp);
                g.textOut(r.getLeft() + w + 10, 10, tmp);
            };
        });