Page 1 of 1
Polygon drawing issue
Posted: Mon Jun 04, 2018 1:20 pm
by 16683749
- demo-001.jpg (204.86 KiB) Viewed 16263 times
- demo-002.jpg (144.14 KiB) Viewed 16263 times
Hi,
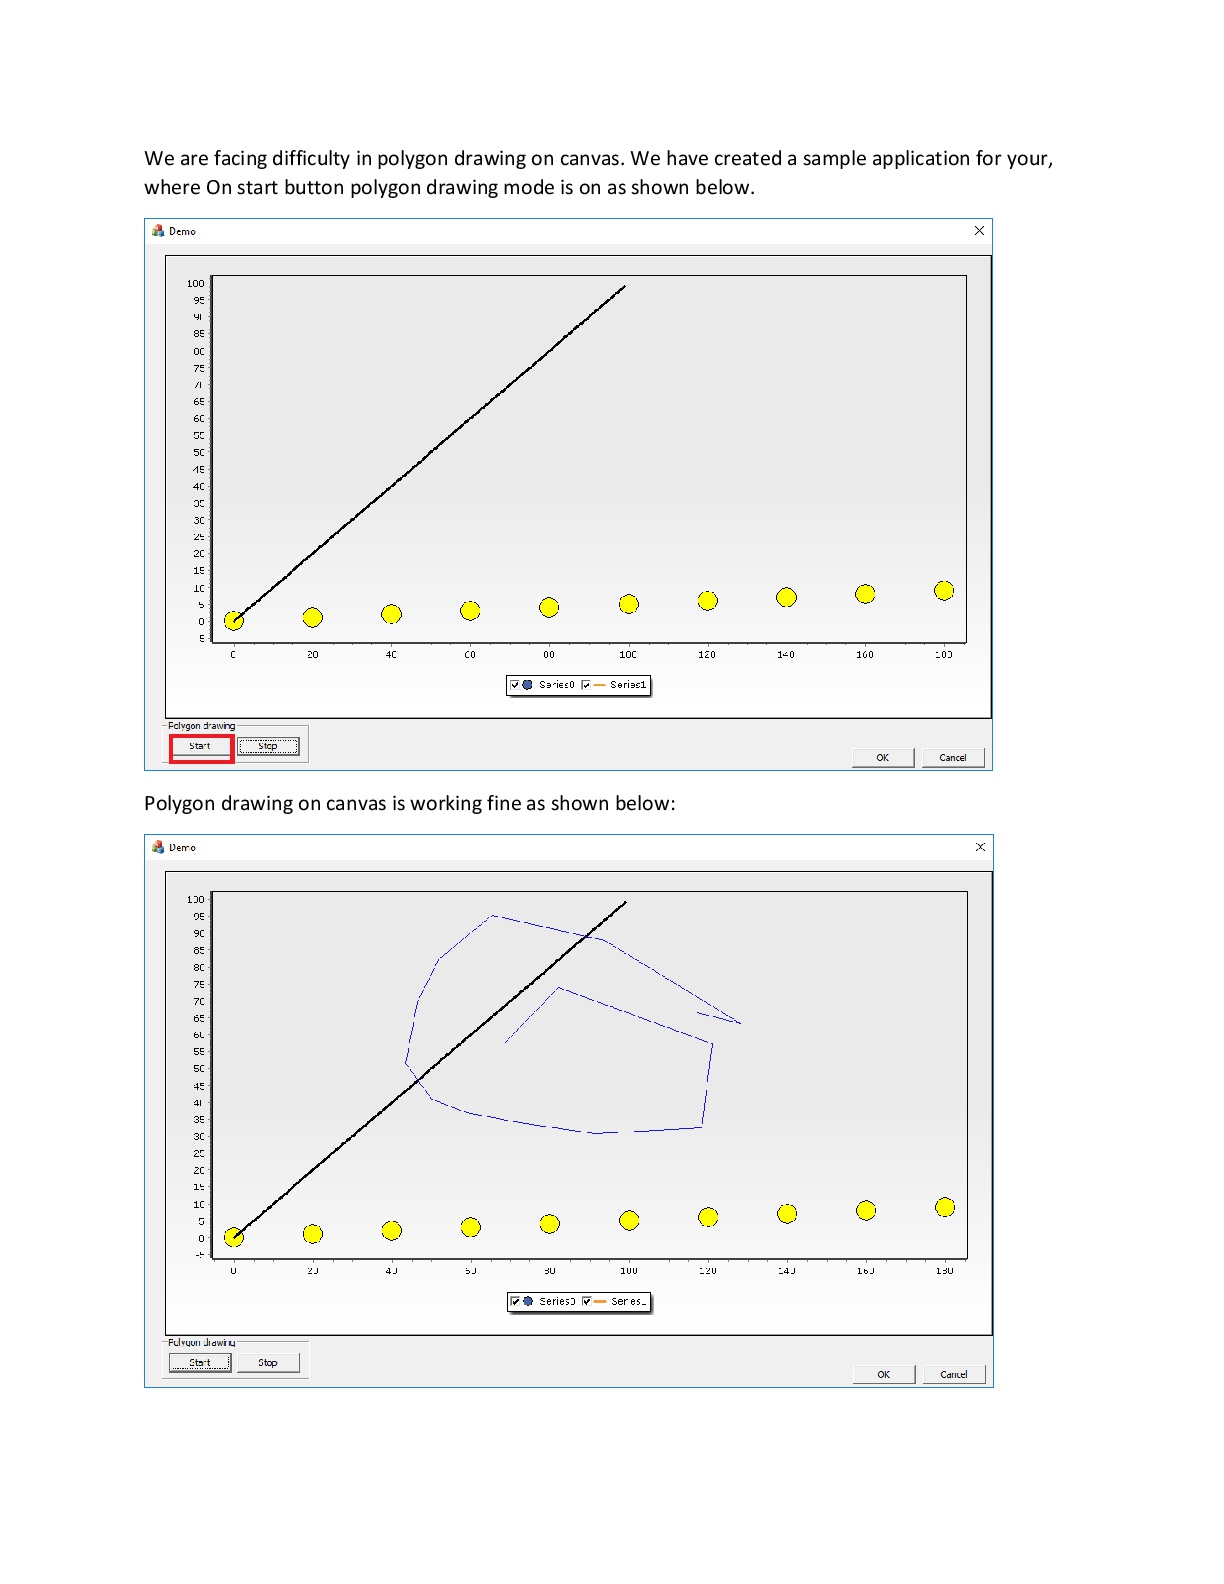
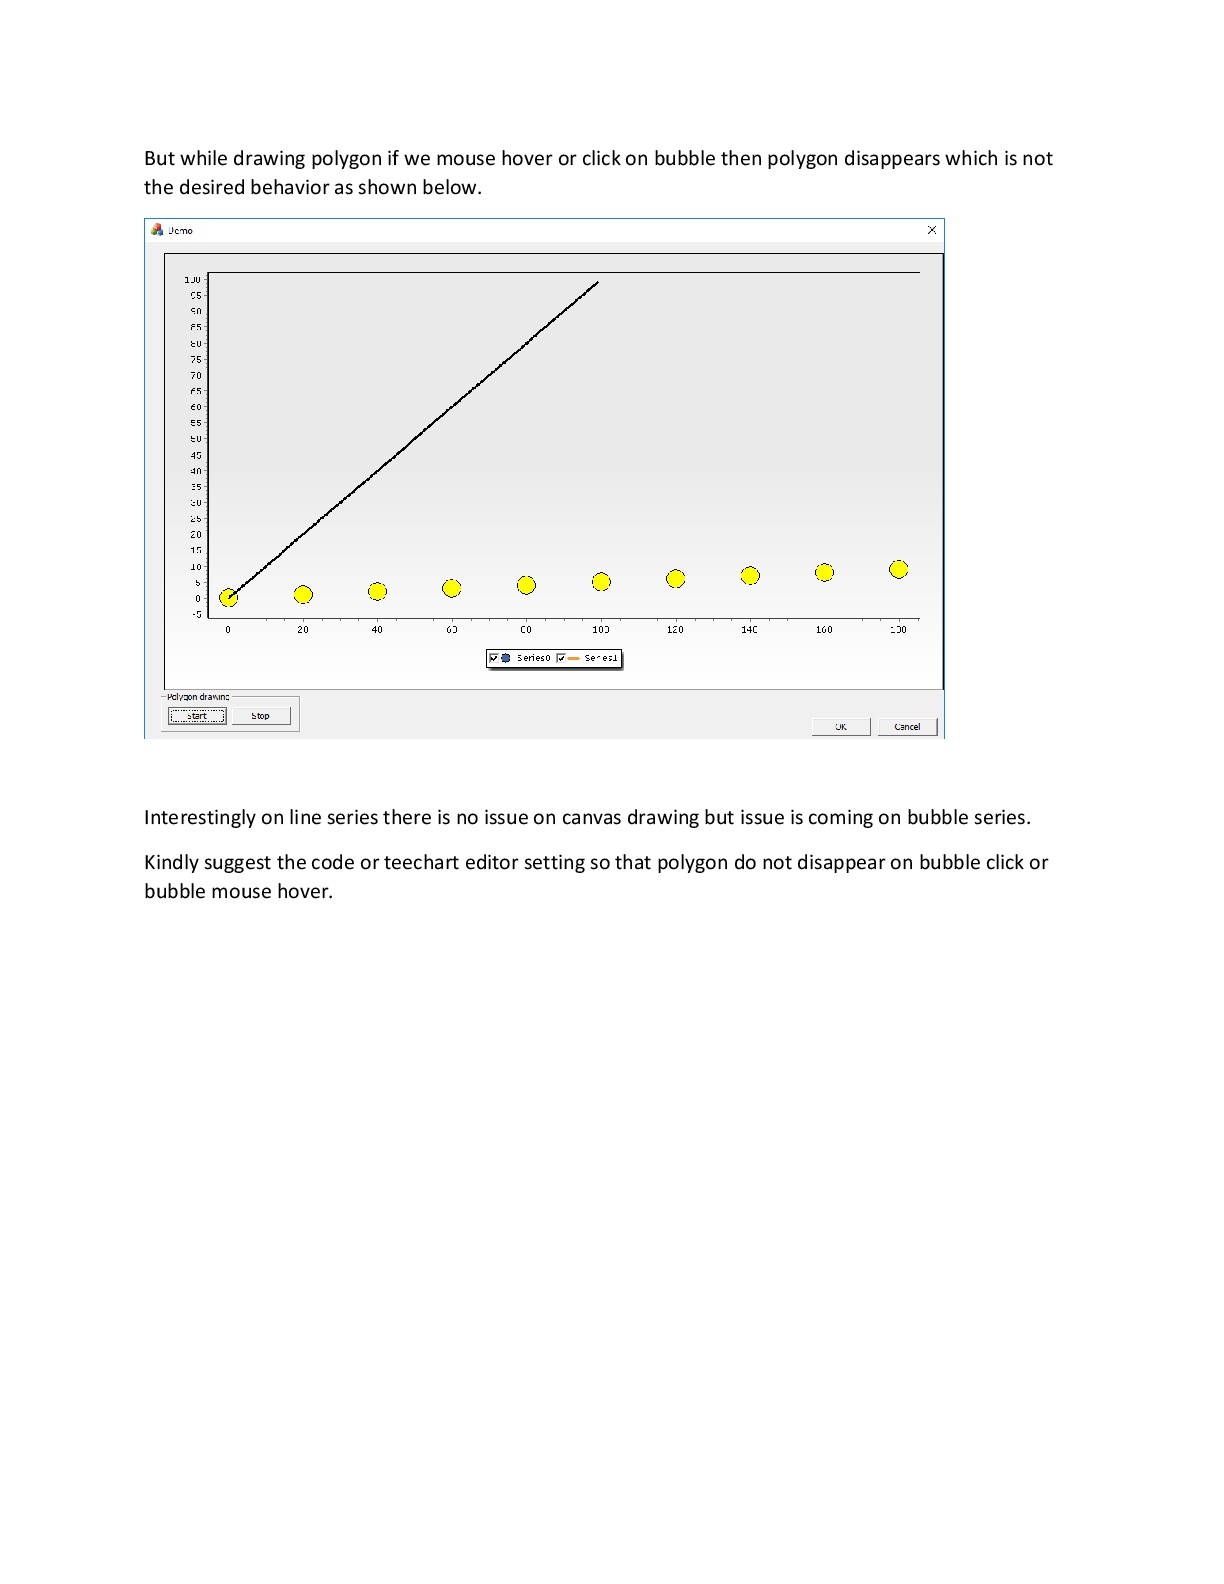
We have recently migrated to the latest version of T-Chart i.e. ActiveX 2018. But after migration we are facing difficulty in polygon drawing on canvas which was working fine earlier. Polygon drawing on canvas while working on line-series is working fine. But while drawing polygon, if we mouse hover or click on bubble series then polygon disappears which is not the desired behavior. Interestingly on line-series there is no issue on canvas drawing but the issue is coming on bubble series.
Kindly suggest the code or teechart editor setting so that polygon do not disappear on bubble click or bubble mouse hover.
Regards,
Bhanu
Re: Polygon drawing issue
Posted: Tue Jun 05, 2018 9:22 am
by yeray
Hello Bhanu,
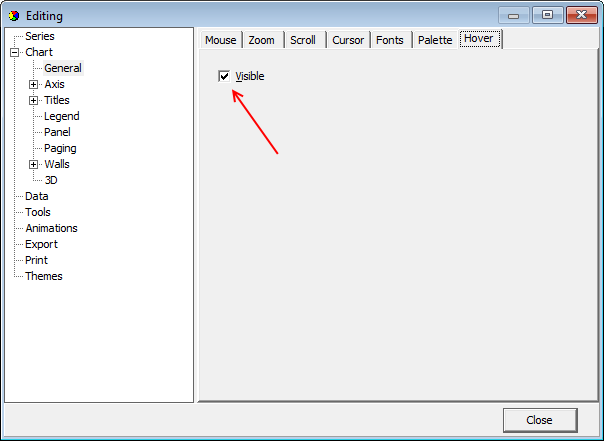
I can't find any test application attached but, according to your description, the problem may disappear as soon as you disable the Hover feature by code or at design time:
- By code:
- At design time:
- VB6_2016-05-30_10-45-03.png (11.51 KiB) Viewed 16257 times
Re: Polygon drawing issue
Posted: Tue Jun 05, 2018 10:37 am
by 16683749
- Demo.7z
- (62.59 KiB) Downloaded 1028 times
Hi Yeray,
Thanks for your response. Based on your suggestion we did tried to toggle off the hover settings, but issue still persists. For reference I am attaching code as well as demo application. We would request you to kindly guide us.
Thanks
Bhanu
These are my default settings in code:
Code: Select all
//.......gdi and hover settings........

m_chart.GetAspect().GetGDIPlus().SetActive(FALSE);
m_chart.GetHover().SetVisible(false);

m_chart.Series(0).GetSelected().GetHover().SetVisible(false);
m_chart.Series(1).GetSelected().GetHover().SetVisible(false);

for (int i = 0; i < 10; i++)
{
	m_chart.Series(0).GetAsBubble().AddBubble(20*i, i,3, (LPCTSTR)"", RGB(255, 255, 0));
}

for (int i = 0; i < 100; i++)
{
	m_chart.Series(1).AddXY(i, i, (LPCTSTR)"", RGB(0, 0, 0));
}

Polygon drawing code:
void CDemoDlg::OnMouseDownTchart1(long Button, long Shift, long X, long Y)
{
	if (IsStartDrawing == true)
	{
		if (Button == 1)
		{
			if (startX == -1 && startY == -1)
			{
				startX = X;
				startY = Y;
				return;
			}

			if (endX == -1 && endY == -1)
			{
				endX = X;
				endY = Y;
			}

			if (endX != -1 && endY != -1 && startX != -1 && startY != -1)
			{
				m_chart.GetCanvas().DrawLine(startX, startY, endX, endY);

				startX = endX;
				startY = endY;

				endX = -1;
				endY = -1;
			}
		}
	}
}
Re: Polygon drawing issue
Posted: Mon Jun 11, 2018 7:22 am
by yeray
Hello,
I'm not sure how the chart is being repainted when you move the mouse over the bubbles. I've exported your chart to a .tee, imported it into a delphi application (note TeeChart ActiveX is a wrapper from the VCL version), added your code at OnMouseDown event and it seems to work fine; without loosing the lines you are manually drawing.
An alternative would be to store your lines start and end points to an array and draw this array at the Chart OnAfterDraw event. This way, if the chart is repainted, the lines will also be repainted.
Re: Polygon drawing issue
Posted: Tue Jun 12, 2018 11:35 am
by 16683749
Thanks a lot. This resolves the issue.