
hi,
we are currently using Tee-Chart Active X v8. and we need to draw like a kind of maps with some data that we have ,
the map that we want is a 2D map, but we were don't know how Countour series manage the coordenates for doing the drawing part.
if you could help us on that with an example we would apreciate it.
Regards
David.
How Contour serie is used???
-
Narcís
- Site Admin

- Posts: 14730
- Joined: Mon Jun 09, 2003 4:00 am
- Location: Banyoles, Catalonia
- Contact:
Re: How Contour serie is used???
Hello David,
My first recommendation is that you need to populate such 3D series in a grid-like manner, as I explained here. This is a Delphi (VCL) thread but the same applies to the ActiveX version. You'll find several contour series examples at the All Features\Welcome!\Chart Styles\Extended\Contour section in the features demo, available at TeeChart's program group.
My first recommendation is that you need to populate such 3D series in a grid-like manner, as I explained here. This is a Delphi (VCL) thread but the same applies to the ActiveX version. You'll find several contour series examples at the All Features\Welcome!\Chart Styles\Extended\Contour section in the features demo, available at TeeChart's program group.
Best Regards,
| Narcís Calvet / Development & Support Steema Software Avinguda Montilivi 33, 17003 Girona, Catalonia Tel: 34 972 218 797 http://www.steema.com |
      |
| Instructions - How to post in this forum |
Re: How Contour serie is used???
hello Narcis,
I read the other reply and I'm not sure I'm using the correct series,
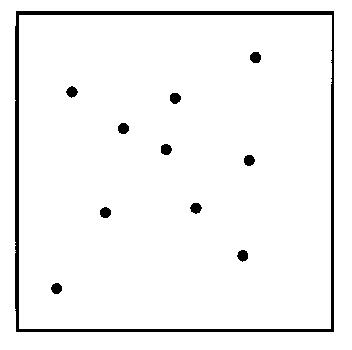
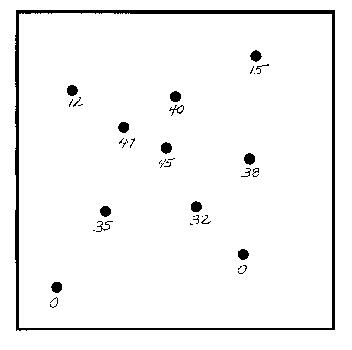
the kind of map that I want to do is something like this
,
in my case the black dots would be the geographical coordinates of a field and the contour of each level depends on a Y value.
this kind of maps could be done using Contour series?
Regards,
David
I read the other reply and I'm not sure I'm using the correct series,
the kind of map that I want to do is something like this
- maps2.jpg (26.18 KiB) Viewed 28990 times
in my case the black dots would be the geographical coordinates of a field and the contour of each level depends on a Y value.
this kind of maps could be done using Contour series?
Regards,
David
Re: How Contour serie is used???
Hi David,
Once you have a Contour series populated (as Narcís explained above) you can add an extra Point series to draw the points you wish.
Here it is an example:
Once you have a Contour series populated (as Narcís explained above) you can add an extra Point series to draw the points you wish.
Here it is an example:
Code: Select all
  TChart1.Aspect.View3D = False

  Dim x, z As Integer
  TChart1.AddSeries scContour
  With TChart1.Series(0).asContour
    For x = 0 To 10
      For z = 0 To 5
        .AddXYZ x, Rnd * 10, z, "", clTeeColor
      Next z
    Next x

    .IrregularGrid = True
  End With

  TChart1.AddSeries scPoint
  For x = 0 To 10
    TChart1.Series(1).AddXY x, Rnd * 5, "", clTeeColor
Next x- test.png (90.55 KiB) Viewed 28966 times
Best Regards,
 | Yeray Alonso Development & Support Steema Software Av. Montilivi 33, 17003 Girona, Catalonia (SP) |
      |
Please read our Bug Fixing Policy |
Re: How Contour serie is used???
hi everyone,
the other posts helped me a lot,
the thing that i hven't figure out is for example drawing a circle using contour on the center of the chart,
if some could help me with that i'll apreciate it.
i nedd to draw a specific figure (circle , triangle ,square ) any of them.
this could be done??
the other posts helped me a lot,
the thing that i hven't figure out is for example drawing a circle using contour on the center of the chart,
if some could help me with that i'll apreciate it.
i nedd to draw a specific figure (circle , triangle ,square ) any of them.
this could be done??
-
Narcís
- Site Admin
- Posts: 14730
- Joined: Mon Jun 09, 2003 4:00 am
- Location: Banyoles, Catalonia
- Contact:
Re: How Contour serie is used???
Hi JAV,
Since Contour series automatically calculates its levels, you'd better draw you own polygons using TeeChart canvas custom drawing methods. You'll find more information on this subject in tutorial 13. Tutorials can be found at TeeChart's program group.
Since Contour series automatically calculates its levels, you'd better draw you own polygons using TeeChart canvas custom drawing methods. You'll find more information on this subject in tutorial 13. Tutorials can be found at TeeChart's program group.
Best Regards,
| Narcís Calvet / Development & Support Steema Software Avinguda Montilivi 33, 17003 Girona, Catalonia Tel: 34 972 218 797 http://www.steema.com |
| |
| Instructions - How to post in this forum |
Re: How Contour serie is used???
hi narcis,
I've already check those tutorials and that isn't exactly what I'm looking for.
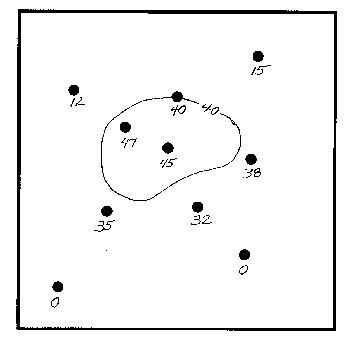
maybe if you could help me with this, for example how can I draw an irregular shape like the one that is attached, wich series could be used for doing something like that.
Regards,
David
I've already check those tutorials and that isn't exactly what I'm looking for.
maybe if you could help me with this, for example how can I draw an irregular shape like the one that is attached, wich series could be used for doing something like that.
Regards,
David
- Attachments
-
- Irregular.jpg (15.52 KiB) Viewed 28913 times
Re: How Contour serie is used???
Hi David,
What about a MapSeries?
Take a look at the exmaple included in the demo at "All Features\Welcome !\Chart styles\Extended\Map GIS"
And here you'll find a simple example of how to draw a triangle:
http://www.teechart.net/support/viewtop ... =3&t=14336
What about a MapSeries?
Take a look at the exmaple included in the demo at "All Features\Welcome !\Chart styles\Extended\Map GIS"
And here you'll find a simple example of how to draw a triangle:
http://www.teechart.net/support/viewtop ... =3&t=14336
Best Regards,
| Yeray Alonso Development & Support Steema Software Av. Montilivi 33, 17003 Girona, Catalonia (SP) |
| |
Please read our Bug Fixing Policy |
How Contour serie is used???
hi
I need a example for contour series apply in progress sofware
please,
Regards
I need a example for contour series apply in progress sofware
please,
Regards
Re: How Contour serie is used???
Hi,
If this IDE supports ActiveX components, it should support TeeChart ActiveX as any other.
But I'm afraid we don't have experience with this software nor with the programming language to use with it.
If this IDE supports ActiveX components, it should support TeeChart ActiveX as any other.
But I'm afraid we don't have experience with this software nor with the programming language to use with it.
Best Regards,
| Yeray Alonso Development & Support Steema Software Av. Montilivi 33, 17003 Girona, Catalonia (SP) |
| |
Please read our Bug Fixing Policy |
Re: How Contour serie is used???
Hi
I am using Tee chart proactive 8 and i m drawing some maps using contour series, the x,y,z values that i am using for these maps are in the interval [0,10000000],
when I'm trying to draw it shows me an error out of memory.
What can i do to fix this?
Regards.
I am using Tee chart proactive 8 and i m drawing some maps using contour series, the x,y,z values that i am using for these maps are in the interval [0,10000000],
when I'm trying to draw it shows me an error out of memory.
What can i do to fix this?
Regards.
Re: How Contour serie is used???
Hi David,
Since you are using an IDE we don't have experience with here, could you please arrange a simple example project without dependencies on any database or similar connections to your particular environment, probably manually populating the series so we can check the code and translate to VB6 and reproduce the problem here?
Or if you have VB6 or any Visual Studio, it would be even better if you could arrange this simple example in any of these environments.
Best Regards,
| Yeray Alonso Development & Support Steema Software Av. Montilivi 33, 17003 Girona, Catalonia (SP) |
| |
Please read our Bug Fixing Policy |
Re: How Contour serie is used???
hi yeray
this is the example in progress soft
vs:RemoveAllSeries NO-ERROR.
vs:Aspect:View3D = False.
vs:ADDSeries (17).
DEFINE VARIABLE endTime1 AS INT NO-UNDO.
DEFINE VARIABLE endTime2 AS INT NO-UNDO.
DO endTime1 = 1000 TO 100000 BY 100:
DO endTime2 = 2000 TO 200000 BY 100:
vs:Series(0):asContour:addXYZ(endTime1,
RANDOM(0,1) * 10000000,
endTime2,
"",
536870912).
END.
END.
my variable endTime1 my variable endTime is in the interval [1,1000000] and i need to draw with these variables
Re: How Contour serie is used???
hi
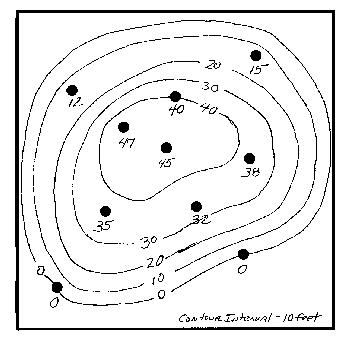
I need help to draw this example
I am trying with series contour but i don´t know how to put the values.
Please I need an example for this kind of graph
How to draw this
Regards
I need help to draw this example
I am trying with series contour but i don´t know how to put the values.
Please I need an example for this kind of graph
How to draw this
Regards
-
Narcís
- Site Admin
- Posts: 14730
- Joined: Mon Jun 09, 2003 4:00 am
- Location: Banyoles, Catalonia
- Contact:
Re: How Contour serie is used???
Hi JAV,
Levels are calculated automatically in Contour series. You should populate them with values as I explained here. Contour series will calculate its levels automatically. You can also set custom levels manually as explained in the All Features\Welcome!\Chart Styles\Extended\Contour\Custom Levels example at the features demo, available at TeeChart's program group.
Levels are calculated automatically in Contour series. You should populate them with values as I explained here. Contour series will calculate its levels automatically. You can also set custom levels manually as explained in the All Features\Welcome!\Chart Styles\Extended\Contour\Custom Levels example at the features demo, available at TeeChart's program group.
Best Regards,
| Narcís Calvet / Development & Support Steema Software Avinguda Montilivi 33, 17003 Girona, Catalonia Tel: 34 972 218 797 http://www.steema.com |
| |
| Instructions - How to post in this forum |