 |
This section describes some design considerations and conventions for working with TeeChart. The section Working with Charts and Series brings to your attention some points of interest that may help with the design of your application.
Topics in this section include:
To understand the design paradigm of TeeChart we need to separate conceptually the contents of the Chart -the data Series- from the Chart itself, e.g. its Axis format, Legend and Titles. We can define and work with Series across Chart boundaries, referencing Series components independently of the Chart. We may, however, copy and paste a Chart and it will copy with all its defined contents, Axis, Legends and Series
Two Chart components
There are 2 Chart components - The distinction serves simply to help cut down memory use for Charts that do not need to access a database.
Projects compiled with using only TChart components, don't need the Borland Database Engine DLL's (BDE). A new TChart will not contain configuration parameters for connecting to a database.
Delphi offers the use of the TClientDataset as a Datasource. It does not use the BDE.
Chart subcomponents
The 2 Chart components have subcomponents. If, for example, you wish to access or modify the property of an axis of your Chart you will be modifying the property of one of the following subcomponents:
BottomAxis
TopAxis
LeftAxis
RightAxis
DepthAxis
See TChartAxis to get a complete list of axis properties. Legend is another example of of a TChart subcomponent.
The Chart as backdrop to your Series
The Chart components provide the backdrop for your data Series. The overall ‘look’ of your Chart is controlled by the Chart properties accessible via the Chart Editor, the Delphi Object Inspector or by coding - see the online help for a complete list.
As a backdrop you have available to you the Delphi Canvas property and methods to calculate screen co-ordinates from values and vice-versa. Every TChart component has a "Canvas" property which is a standard Delphi TCanvas object.
Associating a Series with a Chart
Series associate with a Chart via a Series property called ParentChart. The Series are moveable between Charts by changing the Chart defined in the ParentChart property. When you add a Series using the TeeChart Editor the ParentChart property of the Series is set automatically to the Chart in which you are working.
Via the Chart editor
After a Chart has been placed on a form, a right button click gives access to the Edit Chart menu (alternatively double-click). The first screen of the Edit Chart menu offers a list of button options to add, delete, clone, change type or title of a Series. Adding a data Series via this menu automatically associates the new data Series with the Chart.
Via the Object Inspector
Whilst browsing the list of components of a form in the Object Inspector you should see all Series added to any Chart on that form. Those Series components are not directly visible on the form but are nevertheless components with accessible properties.
If, for example, and you could try this with a simple test, you have 2 Charts on your form and have used the Chart editor to add a Series to one of the Charts - you could now access the property list of that Series in the Object Inspector and change the name of ParentChart to the other Chart on the form. On now opening the Chart editor for the new ‘ParentChart’ you will see the Series. Of course if you make this move for a Series defined with DataSource from a TDBChart to a TChart you will lose the ability to access the DataSource as the TChart is not database aware.
Via code
Use the ParentChart property to associate (or disassociate) a Series with a Chart.
Example:
In Form1, we'll create and show another Form (Form2), and assign Form1.LineSeries1 to Form2.ChartInForm2 :
With TForm2.Create(Self) do
try
    Self.LineSeries1.ParentChart := ChartInForm2 ;
    ShowModal ;
finally
    Free ;
end ;
That will show Form2 (containing a Chart component) and drawing Form1.LineSeries1.
Often used parameters
All the parameters associated with Charts are useful at the time you need them. We cover a few frequently used properties in detail below as an introduction. For a more detailed study of these and many other configurable parameters please refer to the remaing Topics of this section, Working with Charts and Series.
Label increment, % separation and angle
It may be difficult to fit all your axis labels onto the axis that displays onscreen - As an example, this is often true of date labels which are long and can have a high incidence of change on the axis.
Label Increments
TeeChart offers Label increment as a means to controlling the frequency of labelling on your Chart axis. You can access the property via the Chart Editor under Axis (select your axis) - Scales - Desired increment. The menu shows you a list of the standard options for time increments (e.g. One second, one minute … one day, etc.) Selecting ‘one day’ will cut out repetitions of date on the axis, showing the date label only once for the point range of that date.
Via code you may access the property as a property of the subcomponent for the relevant axis.
Example:
Chart1.BottomAxis.Increment := DateTimeStep[ dtOneHour ] ;
Chart1.RightAxis.Increment  := 1000 ;
% Separation
If the labels on the axis have a look of rolling into one another you can increase the % separation which will forcibly increase the gap between them. In some cases this may, as a result, hide some labels. It will very much depend on your labels and whether your Chart users will have the option to ‘resize’ their Chart.
The option is available in the Chart Editor under Axis (select your axis) - Labels - % Separation.
Setting Labels Separation to 0 % means no overlapping checking will be performed, thus all axis labels will be displayed.
Angle
If it is neither practical or possible to place the axis labels side to side along the axis another option is change the angle of the labels to 90º to the axis. This option is available in the Chart Editor under Axis (select your axis) - Labels - % Angle.
BitMaps (BMP) or Metafiles
TeeChart offers both the bitmap (BMP ) and the Metafile format to save Charts. Two type of metafile formats are supported WMF (Windows Metafile Format) and EMF (Extended Metafile Format).
Bitmap format is used internally by TeeChart. It is quicker to draw onscreen than a Metafile. When requiring a Chart to be ‘exported’ to another application or to be embedded in a container application such as MSWord a Metafile format handles resizing better onscreen - TeeChart uses Metafile format with QuickReport.
Zoom
TeeChart offers as default zoom on all Charts. To obtain zoom at runtime hold the left mouse button and drag mouse toward down/right. You'll see a rectangle around the selected area. Release the left mouse button to Zoom. You can continue zooming again and again. To RESTORE (or UNDO) the zoom, drag a rectangle in the opposite direction (up/left).
Note
You may use mouseclicks to activate code associated with points in data Series. That OnClick behaviour will override zoom behaviour. You can set toggle between OnClick events and zoom with the CancelMouse property.
You may enable or disable zoom functionality in the Chart Editor - Chart page, General tab. The option, Zoom.Allow accesses the Chart property, also changeable by code:
Chart1.Zoom.Allow := False;‘False’ deactivates zoom.
Zoom can also be obtained via coding. It is necessary to obtain the screen pixel co-ordinates for the area in which you wish to do the zoom.
Example 1:
Zoom an area with "pixel" co-ordinates:
Rect.Left  := 123 ;
Rect.Top   := 67 ;
Rect.Right := 175 ;
Rect.Bottom:= 100 ;
Chart1.ZoomRect( Rect );
Example 2:
Zoom an area with point value co-ordinates:
You need first to translate from value to pixel co-ordinates. To do so, you can use the Axis or Series components.
Rect.Left  := LineSeries1.CalcXPosValue(22.5);
Rect.Top   := LineSeries1.CalcYPosValue(5000);
Rect.Right := LineSeries1.CalcXPosValue(57.6);
Rect.Bottom:= LineSeries1.CalcYPosValue(15000);
Chart1.ZoomRect(Rect);
Backimage
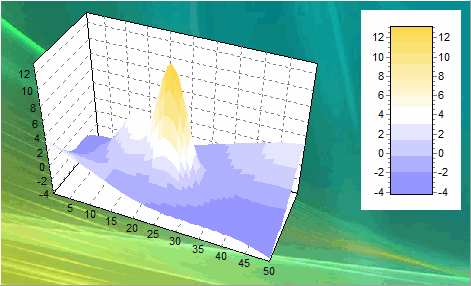
You can add more information to your Chart or simply enhance its appearance by adding a bitmap as a backdrop.
| Bitmap as a Chart backdrop |  |
You will find the parameters to define your Chart backdrop in the General tab of the Chart page of the Chart editor.