 |
Many of the steps necessary for defining a TChart or TDBChart are the same. This section describes the common steps needed to start defining either of the two types of Chart.
Create a new Form.
Create a new form and place a TChart or TDBChart component on it (drag it across from the component palette).
Drag the corners of the new TChart or TDBChart component out to a size that helps you visualise the contents of the new Chart as you define it. Later you can adjust the size of the Chart to suit your needs.
Edit the new Chart
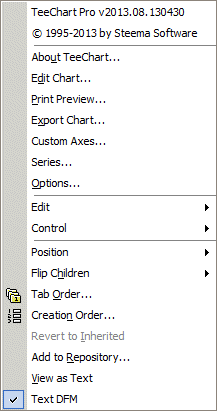
Position the mousepointer over the new Chart and press the right mousebutton. A menu appears that includes the ‘Edit Chart’ option.
| Fig. 1. Using the right mouse button on the Chart will call the Chart options menu. |  |
Select the Edit Chart… option to edit the Chart and define and populate its data Series.
Go to the next step.