Kurtosis function
The “peakedness” or flatness of the graph of a frequency distribution especially with respect to the concentration of values near the mean as compared with the normal distribution.
Measure of the relative concentration (flatness or peakedness) of data values in the center versus in the tails of a frequency distribution when compared with normal distribution (which has a kurtosis of 3). Distributions having higher kurtosis have fatter tails or more extreme values (a phenomenon called 'leptokurtosis'), and those with lower kurtosis have fatter middles or fewer extreme value (a phenomenon called 'platykurtosis'). From the Greek 'kyrtosis,' convexity.
Kurtosis (the term first used by Pearson, 1905) measures the "peakedness" of a distribution. If the kurtosis is clearly different than 0, then the distribution is either flatter or more peaked than normal; the kurtosis of the normal distribution is 0.
Calculation:
Kurtosis =
[n*(n+1)*M4 - 3*M2*M2*(n-1)]/[(n-1)*(n-2)*(n-3)*![]() 4]
4]
where:
Mj is equal to: ![]() (xi-Meanx)j
(xi-Meanx)j
n is the valid number of cases
![]() 4
is the standard deviation (sigma) raised to the fourth power
4
is the standard deviation (sigma) raised to the fourth power
Skewness and kurtosis
Skewness and kurtosis describe the shape
of your data set's distribution. Skewness indicates how symmetrical the
data set is, while kurtosis indicates how heavy your data set is about its mean
compared to its tails. Perfectly symmetrical data sets will have a
skewness of zero, and a normally distributed data set will have a kurtosis of
approximately three.
For example, this histogram (with an overlay of what a perfect normal
distribution would have been) represents the total sample set available in the
Access database included with this article:
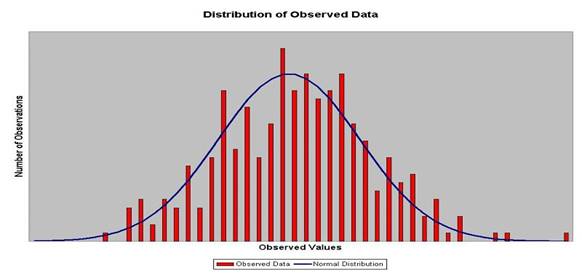
As we can see, the sample set is reasonably symmetrical, and the overall
distribution appears to be close to a normal distribution, and thus we would
expect to find a skewness of close to zero, and a kurtosis of close to three.
(Note: While a normal distribution has kurtosis ˜ 3, other distributions can
have a kurtosis of 3, and thus you cannot use kurtosis alone to test the
likelihood that your sample was drawn from a normal distribution.
Statisticians have devised numerous other normality tests.)
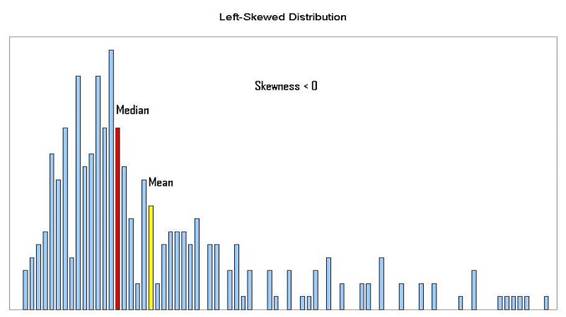
Data sets are sometimes asymmetrical. For example, for a left-skewed data
set, the median will be lower than the mean, and the skewness will be negative,
as seen in this chart:
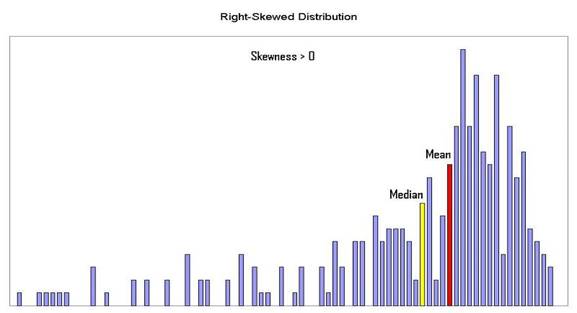
In right-skewed data sets, the median is greater than the mean, and the
skewness is positive:
In a high kurtosis distribution (kurtosis > 3), data will be clustered much
more about the mean, and the tails will be relatively lighter. The chart
below shows a distribution with a relatively high kurtosis (5.3); this
distribution has a high proportion of its data points clustered about the mean,
and the tails are very light:

Among the commonly-encountered probability distributions described in
statistics, the Bernoulli distribution (for probability
close to 0% or 100%), Laplace distribution and the logistic distribution tend to have high kurtosis values.
In a low kurtosis distribution (kurtosis < 3), data will not have a
pronounced peak about the mean, and will consequently have heavier tails, The
chart below shows a distribution with a relatively low kurtosis (1.5); this
distribution has relatively few data points clustered about the mean, and the
tails are very heavy:
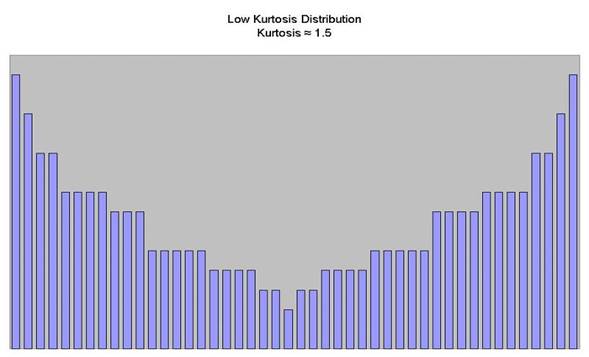
Examples of probability distributions with low kurtosis values include the Bernoulli distribution (for probability
close to 50%; p = 50% generates the lowest possible kurtosis value, 1), and the
discrete uniform distribution.
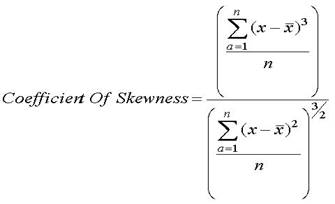
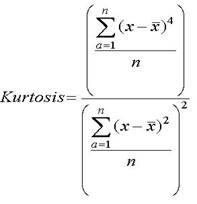
The formulas for skewness and kurtosis are as follows:
Examples
of Kurtosis:
http://en.wikipedia.org/wiki/Kurtosis
The heaviness of the tails of a distribution affects the behaviour of many statistics. Hence it is useful to have a measure of tail heaviness. One such measure is kurtosis. The population kurtosis is usually defined as
![]()
Note: Some
statisticians omit the subtraction of 3. ![]()
Because the
deviations are raised to the fourth power, positive and negative deviations
make the same contribution, while large deviations are strongly emphasized.
Because of the divisor ![]() , multiplying each
value by a constant has no effect on kurtosis.
, multiplying each
value by a constant has no effect on kurtosis.
Population
kurtosis must lie between ![]() and
and ![]() ,
inclusive. If
,
inclusive. If ![]() represents
population skewness and
represents
population skewness and ![]() represents
population kurtosis, then
represents
population kurtosis, then
![]()
Statistical literature sometimes reports that kurtosis measures the peakedness of a density. However, heavy tails have much more influence on kurtosis than does the shape of the distribution near the mean (Kaplansky 1945; Ali 1974; Johnson, et al. 1980).
Sample skewness and kurtosis are rather unreliable estimators of the corresponding parameters in small samples. They are better estimators when your sample is very large. However, large values of skewness or kurtosis may merit attention even in small samples because such values indicate that statistical methods that are based on normality assumptions may be inappropriate.
References:-
Merrian-Webster
http://www.merriam-webster.com/dictionary/kurtosis
Business Dictionary
http://www.businessdictionary.com/definition/kurtosis.html
Experts Exchange
http://www.experts-exchange.com/articles/2529/Median-Mode-Skewness-and-Kurtosis-in-MS-Access.html