Accumulation/distribution
index
The accumulation/distribution line or accumulation/distribution
index is a technical analysis indicator intended to relate
price and volume in the stock market.
Calculation:
![]()
This ranges from -1 when the close is the low of the day, to +1 when it's the high. For instance if the close is 3/4 the way up the range then CLV is +0.5. The accumulation/distribution index adds up volume multiplied by the CLV factor, i.e.
![]()
The starting point for the acc/dist total, i.e. the zero point, is arbitrary, only the shape of the resulting indicator is used, not the actual level of the total.
The name accumulation/distribution comes from the idea that during accumulation buyers are in control and the price will be bid up through the day, or will make a recovery if sold down, in either case more often finishing near the day's high than the low. The opposite applies during distribution.
The accumulation/distribution index is similar to on balance volume, but acc/dist is based on the close within the day's range, instead of the close-to-close up or down that the latter uses.
Trend-Spotting With The Accumulation/Distribution Line
By John Devcic
The accumulation/distribution line was created by Marc Chaikin to determine the flow of money into or out of a security. It should not be confused with the advance/decline line. While their initials might be the same, these are entirely different indicators, and their uses are different as well. Whereas the advance/decline line can provide insight into market movements, the accumulation/distribution line is of use to traders looking to measure buy/sell pressure on a security or confirm the strength of a trend. Read on to learn how to use accumulation/distribution to analyze a security. (Read more about Marc Chaikin in Discovering Keltner Channels And The Chaikin Oscillator.)
Close Location Value
The first step in creating the accumulation/distribution (A/D) line is finding the close location value (CLV), which looks at the location of the close and compares it to the range for a given period (one day, week or month). The CLV will have a value from +1 to -1:
- A value of zero would mean that the price closed halfway between the high and low of the range.
- A value of +1 means the close is equal to the high of the range.
- A value of -1 means the close is equal to the low of the range.
The CLV can be calculated as follows:
|
CLV = ([(C-L) - (H - C)] / (H - L)) |
Where:
C = the closing price
H = the high of the price range
L = the low of the price range
The CLV is then multiplied by the corresponding period's volume, and the total will form the A/D line. (For a look at the CLV's precursor, the on-balance volume, read Introduction To On-Balance Volume.)
Benefits and Drawbacks of using the A/D Line
In some instances, using the A/D line can give traders a clear advantage:
- Monitor General Money Flow - The A/D line can be used as a gauge for the general flow of money. If the A/D line is moving higher, this signals that there is buying pressure that is starting to prevail. On the flip side, if the A/D line is moving downward, this signals that increased selling pressure is beginning to gain a foothold.
- Confirmation - You can also use the A/D line to confirm the strength, and possibly the longevity, of a current move.
There are also a few drawbacks to keep in mind when analyzing a security using the A/D line:
- Trading Gaps - The A/D line does not take trading gaps into consideration, so these gaps, when they occur, may not be factored into the A/D line at all. Therefore, if a stock's price has gapped upward but closes around the midpoint, that gap will be ignored because the A/D line is formulated using closing prices. (To learn about profiting from trading gaps, read Playing The Gap.)
- Minor Changes - Sometimes it can be difficult to detect minor changes in volume flows. The rate of change in a downtrend could be slowing, but this would be difficult (if not impossible) to detect until the A/D line turned upward. (To learn how to monitor trends in volume, read Volume Rate Of Change.)
Bullish and Bearish Signals
The A/D line creates both bullish and bearish signals. These signals rely ondivergence and confirmation.
Bullish Signals
Bullish signals occur when the price of a security is moving down or is in a downtrend, but A/D line is trending upward (see Figure 1). This divergence signals increased buying pressure, which can indicate weakening seller strength. It is usually followed by a change in the trend of the security from downward to upward.
|
|
|
Figure 1: A chart of Goldman Sachs (NYSE:GS) clearly shows that the current A/D line has moved positively while the stock continues to be in a downward trend. |
|
Source: StockCharts.com |
Bearish Signals
A bearish signal is formed when the A/D line is trending downward, but the price of the security is in an uptrend (see Figure 2). Selling pressure is beginning to increase, which usually signals a future downtrend in the price.
|
|
|
Figure 2: A chart of AT&T (NYSE:ATT) shows the A/D line moving downward while the stock price continues its uptrend. While the divergence is early, what you are looking for is a separation between the price and the A/D line. |
|
Source: StockCharts.com |
Spotting a Divergence
In order to spot bearish and bullish signals, you need to have a trend in the underlying security. Once this has been established, you can begin to look for a divergence from that trend. When spotting these divergences, either bullish or bearish, it is best to allow a week or two for the signals to develop. When it comes to bearish patterns, you want to keep an eye out for signals that are flat or do not have a sharp divergence – these can also signal that no future change is probable
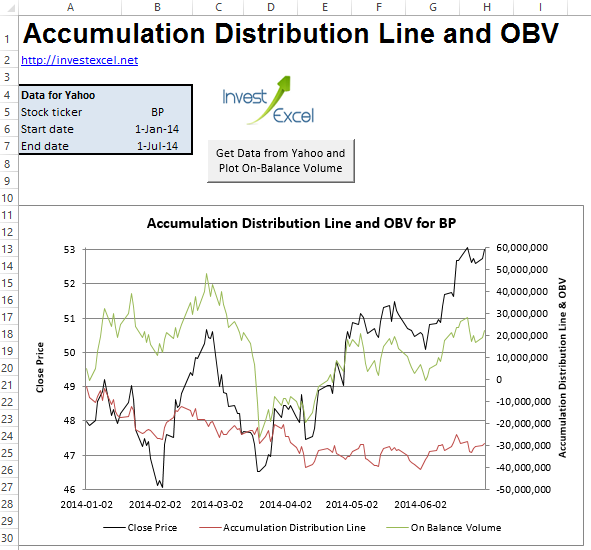
Accumulation Distribution Line
Samir Khan2
Detect hidden buying or selling pressure with accumulation distribution line
Developed by analyst Marc Chaikin, the accumulation-distribution line (ADL) measures the volume of money flowing into or out of a stock.
Technical traders use ADL as a proxy for underyling buying and selling pressure.
It’s commonly employed to confirm the predictions of other indicators (commonly RSI), and is a close-relation of on-balance volume.
Excel can help you calculate and plot ADL using a little VBA. You can download a web-connected VBA-powered spreadsheet from the link at the bottom of this post, but first let’s review the key formula and calculations.
Step 1
For day n, calculate the Close Location Value (CLV), also known as the Money Flow Multiplier.
![]()
Step 2
Then calculate the money flow volume.
![]()
Step 3
Finally, calculate the accumulation-distribution line.
![]()
CLV measures the distance of the close price from the high or low, and ranges between -1 and 1. If CLV is
- positive, the close is nearer to the high than the low
- negative, the close is nearer to the low than the high
- equal to 0, the close is midway between the high and the low
ADL is often used to confirm trends or predict reversals. For example, if prices track upwards but the ADL falls, a price reversal might be imminent. This is because falling ADL is associated with selling pressure.
This Excel spreadsheet employs some clever VBA to
- downloads stock data from Yahoo Finance
- programatically write the formulas to calculate ADL and OBV
- and generate charts plotting both against the close price
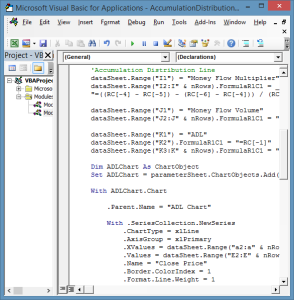
Here’s a snippet of the VBA – the part that programmatically writes the formulas that calculate ADL and OBV into a range of cells.
|
'On Balance Volume dataSheet.Range("H1") = "OBV" dataSheet.Range("H2").FormulaR1C1 = "= RC[-2]" dataSheet.Range("H3:H" & nRows).FormulaR1C1 = _ "=IF(RC[-3] = R[-1]C[-3], R[-1]C, IF(RC[-3] > R[-1]C[-3], R[-1]C[0] + RC[-2], R[-1]C[0] - RC[-2] ))"
'Accumulation Distribution Line dataSheet.Range("I1") = "Money Flow Multiplier" dataSheet.Range("I2:I" & nRows).FormulaR1C1 = _ "=((RC[-4] - RC[-5]) - (RC[-6] - RC[-4])) / (RC[-6]-RC[-5]) "
dataSheet.Range("J1") = "Money Flow Volume" dataSheet.Range("J2:J" & nRows).FormulaR1C1 = "= RC[-1] * RC[-4]"
dataSheet.Range("K1") = "ADL" dataSheet.Range("K2").FormulaR1C1 = "=RC[-1]" dataSheet.Range("K3:K" & nRows).FormulaR1C1 = "= R[-1]C + RC[-1]" |
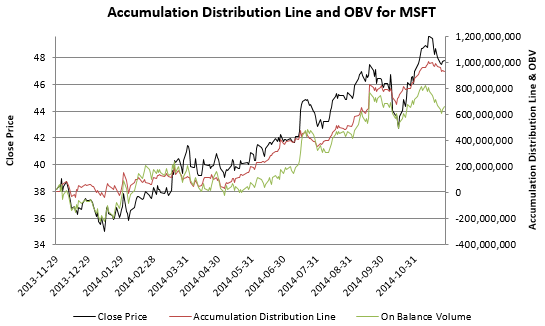
This is the ADL and OBV of Microsoft (MSFT) from 28th November 2013 to 28th November 2014 generated by this spreadsheet. The ADL and OBV rise in tandem with the price, confirming a strong trend.
http://en.wikipedia.org/wiki/Accumulation/distribution_index