Alligator Indicator
Bill Williams introduced the Alligator indicator in 1995. The Alligator is as much a metaphor as it is an indicator. It consists of three lines,
overlaid on a pricing chart, that represent the jaw, the teeth and the lips of
the beast, and was created to help the trader confirm the presence of a trend
and its direction. The Alligator indicator can also help traders
designate impulse and corrective wave formations, but the tool works best when
combined with a momentum indicator.
The
“traits” of the Alligator are numerous. If the three lines are entwined,
then the Alligator’s mouth is closed and he is said to be sleeping. As he
sleeps, he gets hungrier by the minute, waiting for a breakout from his slumber
when he will eat. When the trend takes shape, the Alligator wakes and
starts eating. Once satiated, the Alligator closes his mouth once again
and goes to sleep.
Alligator Formula
The Alligator indicator is common on Metatrader4 trading software, and the calculation formula sequence involves these straightforward steps:
1) The Alligator’s Jaw, the “Blue” line, is a 13-period Smoothed Moving Average, moved into the future by 8 bars;
2) The Alligator’s Teeth, the “Red” line, is an 8-period Smoothed Moving Average, moved by 5 bars into the future;
3) The Alligator’s Lips, the “Green” line, is a 5-period Smoothed Moving Average, moved by 3 bars into the future.
Software programs do the hard work and produce a chart similar to the one below:
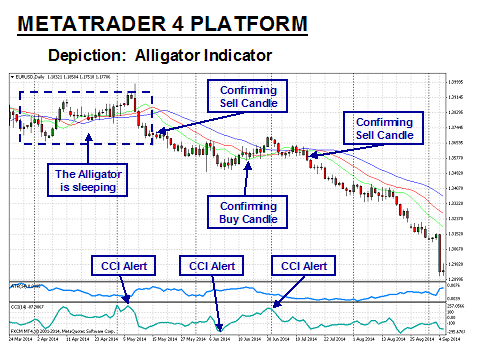
The Alligator indicator is composed of three smoothed moving averages. Traders will occasionally add an “Oscillator” like the “CCI”, as above in Aqua, to enhance the value of the trading signals. In the example above, the “Jaw”, “Teeth”, and “Lips” are entwined while the Alligator sleeps during the initial part of the price action depicted. When the Alligator awakes, the Green line moves first, followed by the Red line, to confirm a breakout in a new direction. In this example, the CCI sent an overbought alert first. The Alligator lagged, but confirmed the signal after a Candle closed beneath the three-line set. The weakness in the indicator is that timing may “lag” due to its future positioning, the reason for attaching a momentum indicator to anticipate the Alligator’s signal.
The Alligator indicator helps the trader stay in the position for a longer period and works best the longer the period of sleep. In the above example, you would stay in the trade until a Candle closed above the middle Red line. Williams also developed a “Gator” histogram indicator to help visually with interpretation, and many other traders have added their own “twist” to enhance the reliability of this indicator.
The next article in this series on the Alligator indicator will discuss how this indicator is used in forex trading and how to read the various graphical signals that are generated.
___________________________________________________________________________
The Alligator Indicator
by Alexander Sabodin
Here's a trading system you can apply to trending markets such as the currencies.
There is a moving average-based trading system that I have found works best in trending markets, with its main instrument the alligator indicator. The alligator was first described by Bill Williams in his book New Trading Dimensions. Some software packages include the alligator indicator, but if it's not available, all you have to do is take three smoothed moving averages using 13, eight, and five periods and shift them by eight, five, and three bars into the future. The longest period line is blue (the alligator's jaw), the middle one is red (the alligator's teeth), and the shortest one is green (the alligator's lips).
According to Williams, when these three moving averages are twisted together, it means the alligator indicator rests, and so we also rest. But the longer the alligator sleeps, the hungrier it is. So when the alligator awakes after a good, long rest it is very hungry to hunt for food. And its food is price.
Your
challenge is to keep company with this animal and hunt with it; otherwise, you
yourself risk being eaten. When all three lines are aligned, going up one after
another with the green being greater than red being greater than blue, prices
are in an uptrend. You need to look into the possibility of buying. In the
event they move down, with the green being less than the red being less than
blue, then you'll be looking into the possibility of selling since it indicates
a downtrend. If moving averages are entwined, then it is best to be out of the
market (Figure 1).
FIGURE 1: THE ALLIGATOR. When the alligator is sleeping, it's best to stay out of the market. When it wakes up is when you should tackle the market with it.
THE TRADING SYSTEM
1. D1 time frame indicates the direction of signals. With the naked eye you can see that prices do not move in a straight line but rather in peaks and troughs. In other words, trends move in waves.
Charles Henry Dow in his Dow theory identified three trend categories: primary, secondary, and minor. The primary tendency is similar to the flow. The secondary resembles waves that constitute flow. The minor trends look like ripples.
The trend is presented in the D1 (daily) time frame as a flow. This means that your aim is to find a wave inside the flow that is moving in a different direction in order to identify a useful entry point. And because of this we use the H4 time frame. At this scale you are waiting for the alligator moving against the day signal.
2. If D1 is in an uptrend, then you need to wait for the downtrend on H4 (four hours). If D1 is in a downtrend, then you must wait for the uptrend on H4. You need to wait for a good entry along the trend (Figure 2). For this reason we use the M30 (30-minute) time frame. Suppose that on the daily chart the alligator looks upward. The next step is to wait for the downward wave on H4. And when the alligator gives a buy signal, after the moving averages cross over and are trending higher, you would enter a long position. The trade system has finished configuration:
D1 upward, H4 downward, M30 buy
D1 downward, H4 upward, M30 sell You can also use this trading system for shorter-term trading. For example:
H4 upward, H1 downward, M5 (five-minute) buy
H4 downward, H1 upward, M5
sell
FIGURE 2: WAITING FOR A GOOD ENTRY. If D1 is in an uptrend, then you need to wait for the downtrend on H4 (four hours). If D1 is in a downtrend, then you would wait for the uptrend on H4.
During the buy or sell signal setup, you
are waiting for a precise and reliable moving average crossover. Now you could
look at the closing price of the candle. If there is a crossover at closing
time, you have a signal. In the event the moving average crossover did not
happen, you would have to wait for the next closing price. Once you have opened
a position, the best area to place a stop-loss is over the price pivot (Figure
3).
FIGURE 3: PLACING THE STOP-LOSS. Here is the stop-loss at the red line, or the alligator's teeth. This line reflects the price pivot.
To define the price target I tend to look at some of the more classic technical analysis. Essentially, we are looking at important resistance and support levels or we wait for a trend reversal or the start of a correction. This means a reversal price pattern or a divergence with price at oscillators. The direction and target of the signals are derived from the lag by the longest of three time frames in this trading system.
Follow the Alligaor
Like all the moving averages, the alligator is a lagging indicator. Such a lag in getting a trade signal leads to a partial loss of profit. Further, this lag functions as a filter and helps eliminate insignificant and false signals.
In testing the alligator indicator, I have found that hunting hand in hand with the alligator works better than all the other moving average crossover systems I have used. The alligator trading system yielded the lowest losses in unfavorable market conditions of all the moving average crossover systems.
_____________________________________________________________
References:-
Forextraders
http://www.forextraders.com/forex-indicators/alligator-indicator-explained.html
http://traders.com/Documentation/FEEDbk_docs/2008/01/ForexFocus/FOREXfocus.html