On-Balance Volume (OBV)
A momentum indicator that uses volume flow to predict changes in stock price. On Balance Volume is a metric developed by Joseph Granville in the 1960s. He believed that, when volume increases sharply without a significant change in the stock’s price, the price will eventually jump upward, and vice versa.
The theory behind OBV is based on the distinction between smart money – namely, institutional investors – and less sophisticated retail investors. As mutual funds and pension funds begin to buy into an issue that retail investors are selling, volume may increase even as the price remains relatively level. Eventually, volume drives the price upward. At that point, larger investors begin to sell, and smaller investors begin buying.
The following chart depicts OBV. If today’s close is greater than yesterday’s close, then today's volume is added to yesterday’s OBV, and is considered “up volume.” However, if today’s close is less than yesterday’s close, today’s volume is subtracted from yesterday’s OBV and is considered “down volume.”
On Balance Volume (OBV) measures buying and selling pressure as a cumulative indicator that adds volume on up days and subtracts volume on down days. OBV was developed by Joe Granville and introduced in his 1963 book, Granville's New Key to Stock Market Profits. It was one of the first indicators to measure positive and negative volume flow. Chartists can look for divergences between OBV and price to predict price movements or use OBV to confirm price trends.
Calculation
The On Balance Volume (OBV) line is simply a running total of positive and negative volume. A period's volume is positive when the close is above the prior close. A period's volume is negative when the close is below the prior close.
If the closing price is above the prior close price then: Current OBV = Previous OBV + Current Volume If the closing price is below the prior close price then: Current OBV = Previous OBV - Current Volume If the closing prices equals the prior close price then:Current OBV = Previous OBV (no change)
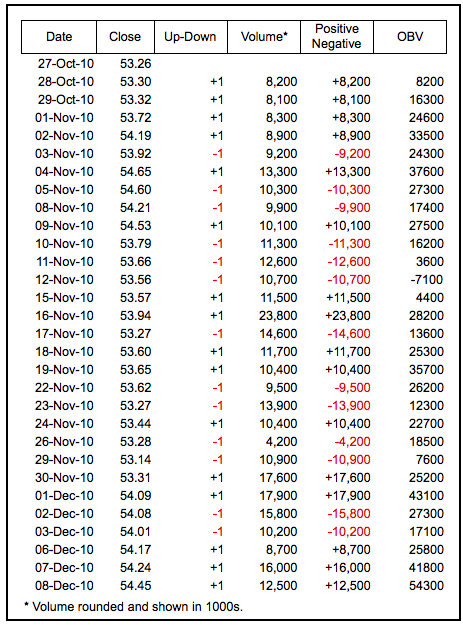
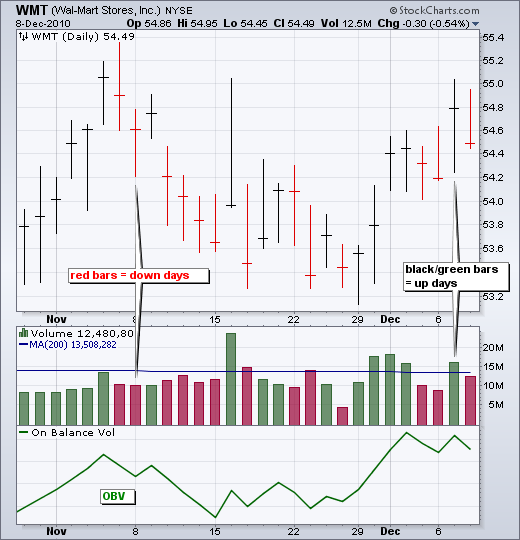
Data in the table above comes from Wal-mart (WMT). Volume figure were rounded off and are shown in 1000's. In other words, 8,200 really equals 8,200,000 or 8.2 million shares. First, we must determine if Wal-mart closed up (+1) or down (-1). This number is now used as the volume multiplier to compute positive or negative volume. The last column (OBV) forms the running total for positive/negative volume. Because OBV has to start somewhere, the first value (8200) is simply equal to first period's positive/negative volume. The chart below shows Wal-mart with volume and OBV.
Interpretation
Granville theorized that volume precedes price. OBV rises when volume on up days outpaces volume on down days. OBV falls when volume on down days is stronger. A rising OBV reflects positive volume pressure that can lead to higher prices. Conversely, falling OBV reflects negative volume pressure that can foreshadow lower prices. Granville noted in his research that OBV would often move before price. Expect prices to move higher if OBV is rising while prices are either flat or moving down. Expect prices to move lower if OBV is falling while prices are either flat or moving up.
The absolute value of OBV is not important. Chartists should instead focus on the characteristics of the OBV line. First define the trend for OBV. Second, determine if the current trend matches the trend for the underlying security. Third, look for potential support or resistance levels. Once broken, the trend for OBV will change and these breaks can be used to generate signals. Also notice that OBV is based on closing prices. Therefore, closing prices should be considered when looking for divergences or support/resistance breaks. And finally, volume spikes can sometimes throw off the indicator by causing a sharp move that will require a settling period.
Divergences
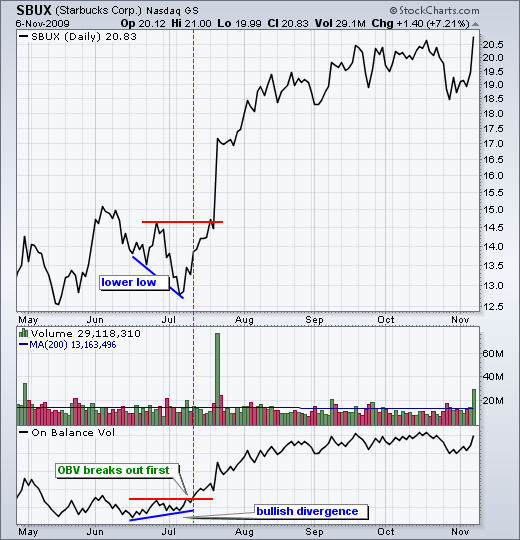
Bullish and bearish divergence signals can be used to anticipate a trend reversal. These signals are truly based on the theory that volume precedes prices. A bullish divergence forms when OBV moves higher or forms a higher low even as prices move lower or forge a lower low. A bearish divergence forms when OBV moves lower or forms a lower low even as prices move higher or forge a higher high. The divergence between OBV and price should alert chartists that a price reversal could be in the making.
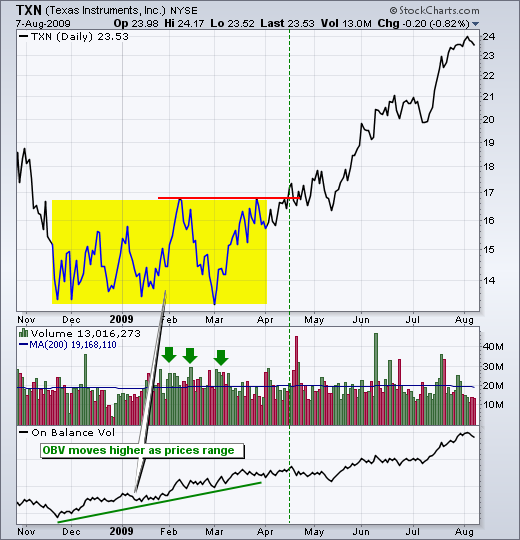
The chart for Starbucks (SBUX) shows a bullish divergence forming in July. On the price chart, SBUX moved below its June low with a lower low in early July. OBV, on the other hand, held above its June low to form a bullish divergence. OBV went on to break resistance before SBUX broke resistance. This was a classic case of volume leading price. SBUX broke resistance a week later and continued above 20 for a 30+ percent gain. The second chart shows OBV moving higher as Texas Instruments (TXN) trades within a range. Rising OBV during a trading range indicates accumulation, which is bullish.
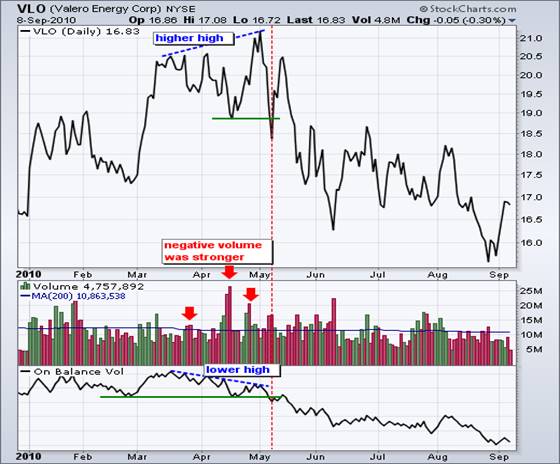
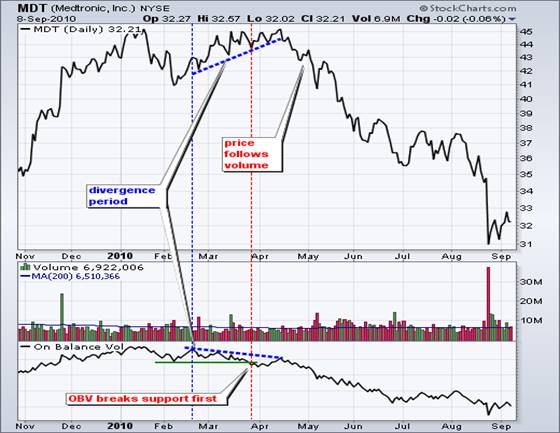
The chart for Medtronic (MDT) shows a bearish divergence with volume leading price lower. The blue dotted lines identify the divergence period. MDT moved higher (43 to 45) as OBV moved lower. Also notice that OBV broke support during this divergence period. The uptrend in OBV reversed with the break below the February low. MDT, on the other hand, was still moving higher. Volume ultimately won the day as MDT followed volume lower with a decline into the low 30s. The second chart shows Valero Energy (VLO) with OBV forming a bearish divergence in April and a confirming support break in May.
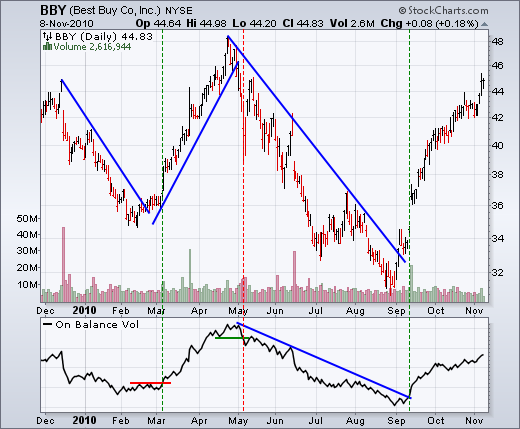
Trend Confirmation
OBV can be used to confirm a
price trend, upside breakout or downside break. The chart for Best Buy (BBY)
shows three confirming signals as well as confirmation of the price trend. OBV
and BBY moved lower in December-January, higher from March to April, lower from
May to August and higher from September to October. The trends in OBV matched
the trend in BBY. OBV also confirmed trend
reversals in BBY. Notice how BBY broke its down trend line in late February and
OBV confirmed with a resistance breakout in March. BBY broke its up trend line
in late April and OBV confirmed with a support break in early May. BBY broke
its down trend line in early September and OBV confirmed with a trend line
break a week later. These coincident signals indicated that positive and
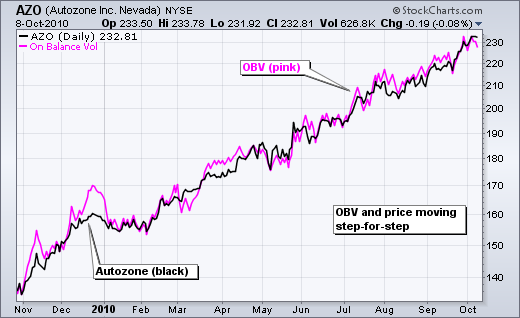
negative volume were in harmony with price. Sometimes OBV moves
step-for-step with the underlying security. In this case, OBV is confirming the
strength of the underlying trend, be it down or up. The chart for Autozone
(AZO) shows prices as a black line and OBV as a pink line. Both moved steadily
higher from November 2009 until October 2010. Positive volume remained strong
throughout the advance. Conclusions
On Balance Volume (OBV) is a
simple indicator that uses volume and price to measure buying pressure and
selling pressure. Buying pressure is evident when positive volume exceeds
negative volume and the OBV line rises. Selling pressure is present when
negative volume exceeds positive volume and the OBV line falls. Chartists can
use OBV to confirm the underlying trend or look for divergences that may
foreshadow a price change. As with all indicators, it is important to use OBV
in conjunction with other aspects of technical analysis. It is not a stand
alone indicator. OBV can be combined with basic pattern analysis or to confirm
signals from momentum oscillators. SharpCharts and On Balance
Volume
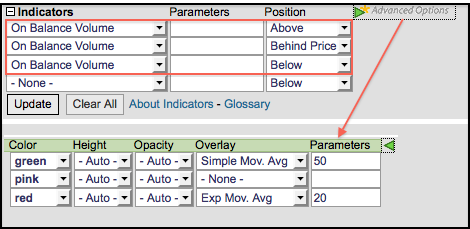
On Balance Volume (OBV) is
available in SharpCharts as an indicator. After selecting, OBV can be
positioned above, below or behind the price plot of the underlying security.
Positioning it behind the plot makes it easy to compare OBV with the underlying
security. Chartists can also add a moving average or another indicator to OBV
by selecting Advanced options, which is to the right of the indicator position.
Click here
for a live chart with On Balance Volume. Suggested Scans
Bullish Divergence in OBV and
ADL: This scan starts with a base of stocks that are averaging at least $10 in
price and 100,000 daily volume over the last 60 days. Potential bullish
divergences are found by looking for stocks where price is BELOW the 65-day SMA
and 20-day SMA, but OBV and the Accumulation Distribution Line are ABOVE the
65-day SMA and 20-day SMA. Bearish divergence in OBV and
ADL: This scan starts with a base of stocks that are averaging at least $10 in
price and 100,000 daily volume over the last 60 days. Potential bearish
divergences are found by looking for stocks where price is ABOVE the 65-day SMA
and 20-day SMA, but OBV and the Accumulation Distribution Line are BELOW the
65-day SMA and 20-day SMA.