|
Version 7
New features.
See latest
Release.txt file with up-to-date changes.
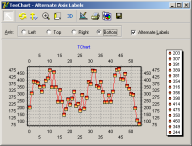
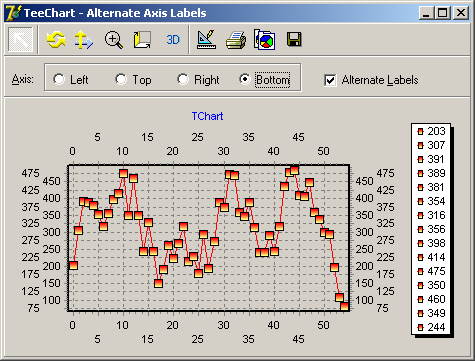
Chart Axes
- Alternate labels.
Axis labels can now be displayed in "alternate" mode to show more text in
the same space.
Suitable for horizontal axis and non-rotated labels.
Chart1.Axes.Bottom.LabelsAlternate := True ;
Bar, Bar3D and Horizontal Bar series
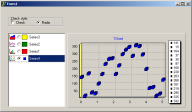
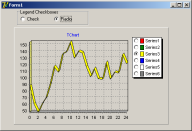
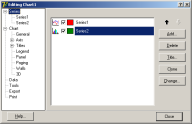
TChartListBox
- Radio buttons
The listbox control can now display series with "radio" buttons instead of
check-boxes.
This can be useful in cases where only a single series needs to be visible.
ChartListBox1.CheckStyle := cbsRadio; // ( default is
cbsCheck )
- OnChangeActive event
This event is called when the end user clicks the checkbox or radio icon to
show or hide a Series. The event includes the Series.
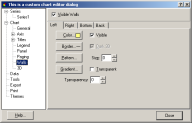
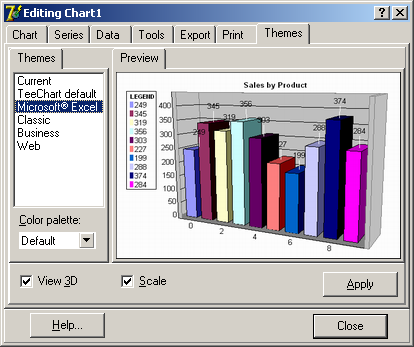
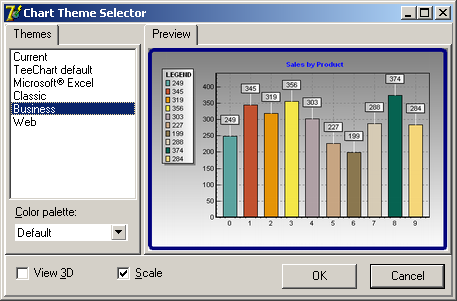
Chart Themes
"Themes" provide an easy single-click way to alter many of the Chart
formatting and color properties.
Included themes are TeeChart, Microsoft Excel®, Business, Classic and Web.
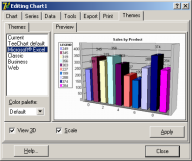
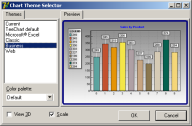
End users can change the selected "theme" at runtime either using the chart
editor dialog new Themes tab or the Themes editor stand-alone.
Uses TeeThemeEditor
ChartThemeSelector( Chart1 );
Themes can also be selected programatically.
Uses TeeThemes;
ApplyChartTheme( TExcelTheme, Chart1 );
New custom themes can be created and used at design-time with simple code:
TMyTheme = class( TChartTheme )
public
procedure ApplyTo( Chart: TCustomChart ); override;
class function Description:String; override;
end;
RegisterChartThemes([ TMyTheme ]);
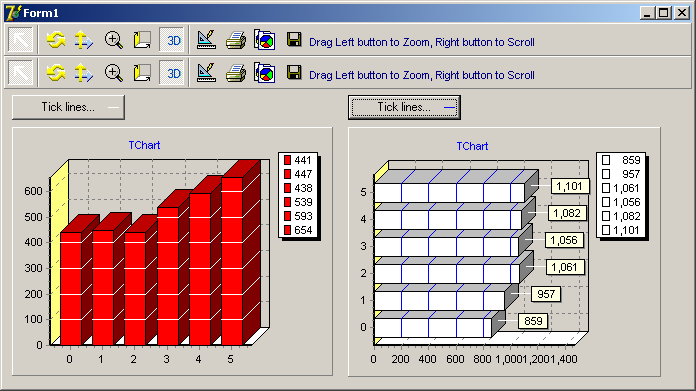
TColorBand tool
- New OnClick event, and Clicked and BoundsRect functions.
The color band object now provides an OnClick event, Clicked function and
BoundsRect function that returns the color band rectangle in pixels.
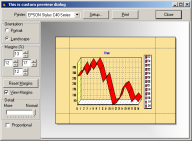
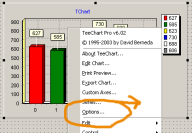
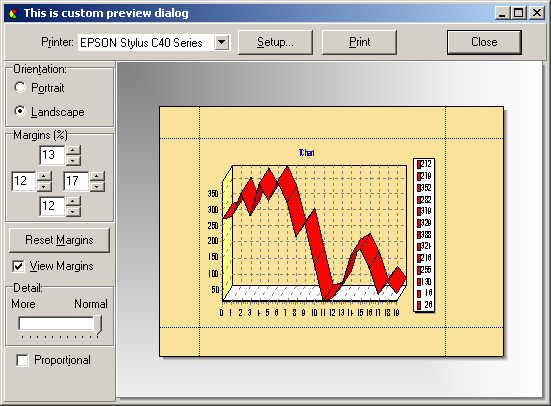
TCommander
- Editor and Previewer
The commander control adds two new properties to show customized chart
editor and print preview dialogs, using your preferred TChartEditor and
TChartPreviewer components:
TeeCommander1.ChartEditor := ChartEditor1 ;
TeeCommander1.Previewer := ChartPreviewer1 ;
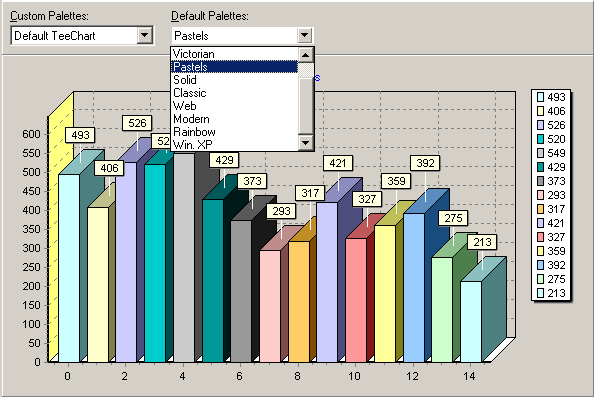
Custom Chart Color Palettes
The default color palette is now a dynamic array that can be replaced by
code:
// Create a custom color palette
var MyPalette : TColorArray;
SetLength(MyPalette, 5);
MyPalette[0]:= clBlue;
MyPalette[1]:= clGreen;
MyPalette[2]:= clLime;
MyPalette[3]:= clAqua;
MyPalette[4]:= clNavy;
SetDefaultColorPalette( MyPalette ); // set new custom palette
MyPalette:= nil; // free if no longer used
Several predefined palettes are available at runtime:
ColorPalettes.ApplyPalette(Chart1, 3); // 3 = pastels

Delphi for .NET
New in this version is support for Borland Delphi™ 2005 .Net compiler.
Under Delphi.Net, applications can be created to use the Borland VCL for .Net (
VCLForms ) or to use Microsoft FCL for .Net ( WinForms ), or ASP.Net web server
pages.
TeeChart v7 VCL is designed to be used in VCLForms (Win32 or .Net) but can also work in
WinForms and ASP.Net forms if you create the necessary encapsulating classes.
For easier programming in WinForms and Asp.Net, we provide TeeChart.Net
(written 100% in C#) which uses .Net Framework classes directly bypassing the
VCL. As with the VCL version, this version can also be used in VCLForms
applications through new a new .Net Control Import Library Wizard.
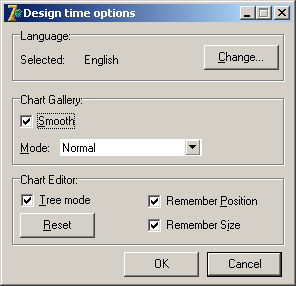
Design Time options
New editor dialog to control all design-time options.
Selections are stored at Windows Registry under key:
HKEY_CURRENT_USER\Software\Steema
Software\TeeChart Pro

The design-time options editor can also be displayed at runtime in your
applications:
uses TeeDesignOptions;
with TOptionsForm.Create( Self ) do
try
ShowModal;
finally
Free;
end;
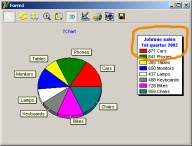
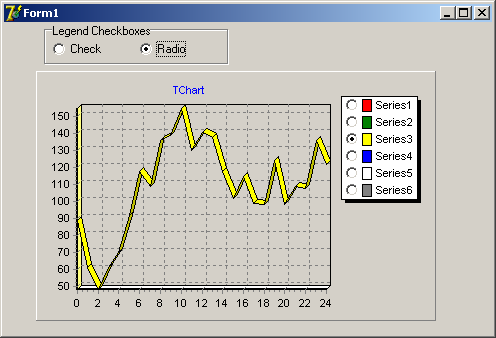
Chart Legend
- Radio groups
Legend can now display "radio" buttons alongside series to let the user
choose a single visible series.
Chart1.Legend.CheckBoxes := True; // activate boxes
Chart1.Legend.CheckBoxesStyle := cbsRadio; // ...or cbsCheck
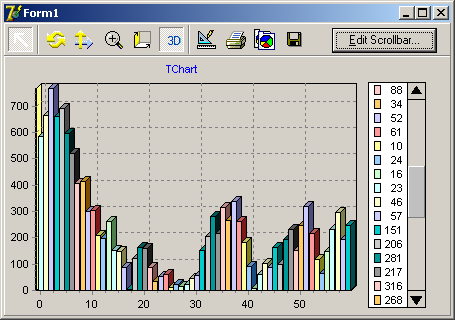
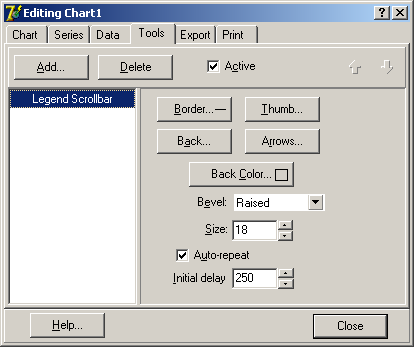
- Scrollbar tool
New tool to add scrollbar facilities to Chart Legend.
The scrollbar is not derived from Windows or Borland's VCL scrollbar
objects. It's been totally rewritten in Delphi with full source code
available.
The scrollbar editor dialog provides many formatting properties like colors,
sizes, etc.
Uses TeeLegendScrollBar;
MyScroll:= TLegendScrollBar.Create( Self );
MyScroll.Size:= 12;
Chart1.Tools.Add( MyScroll );

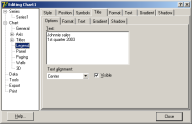
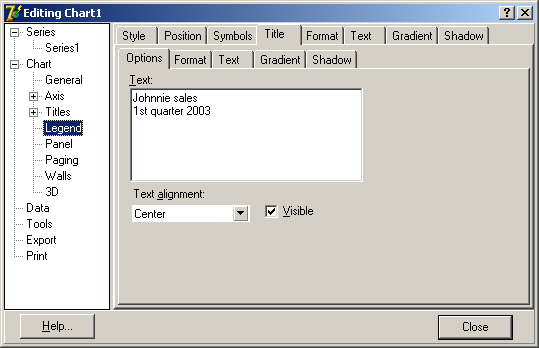
- Legend Title
The Chart Legend provides a new property "Title" of class
TTeeShape.
Legend Title text and formatting can be fully customized.
with Chart1.Legend.Title do
begin
Text.Clear;
Text.Add( 'Animals' );
Color:= clMaroon;
Transparent:= False;
Transparency:= 50;
end;
- Miscellaneous
New LastValue (Integer)
read-only public property.
Returns the value index of the last visible item in legend.
This complements the already existing
FirstValue property.
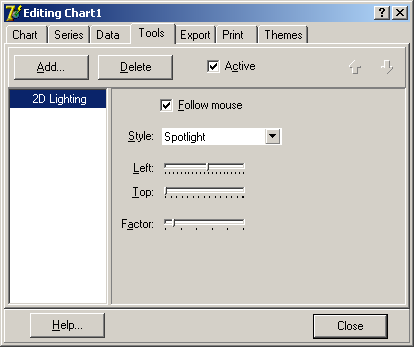
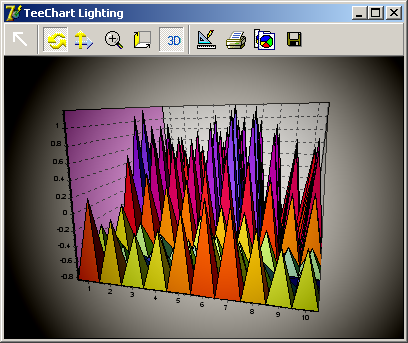
New 2D Lighting Tool
The new TLightTool class enables "2D lighting" effect to charts.
Several properties can be customized using the Light tool editor dialog.
uses TeeLighting;
var Light : TLightTool;
Light:= TLightTool.Create( Self );
Light.FollowMouse:= True;
Light.Style:= lsSpotLight;
Chart1.Tools.Add( Light );


New Functions
- Mode
The Mode function calculates the value with highest count of duplicates inside the source series
data.
Includes the option to ignore null source values.
- Correlation
Calculates the factor, from 0 to 1, of X to Y relationship of source series
values.
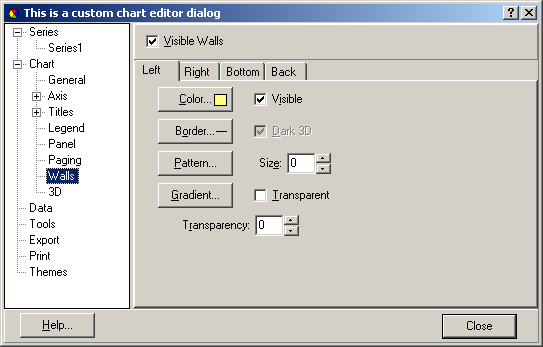
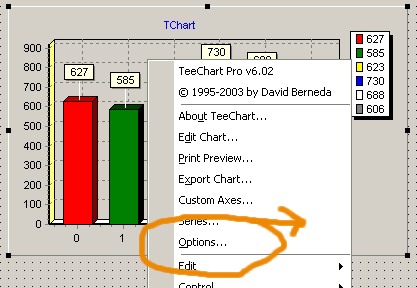
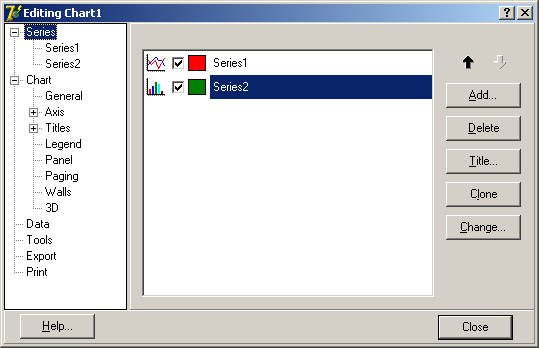
Chart Editor
- Tree mode
The Chart Editor dialog can now be displayed in "tree mode", using a
left-aligned treeview control as the main manager of the many editor dialogs.
The above design-time options dialog
controls the default editor mode (normal or tree).
The
ChartEditorPanel control can also be displayed in tree-mode.

You can also programatically force the tree mode display:
TChartEditForm.SaveOption( TeeMsg_TreeMode, True );
ChartEditor1.Execute;
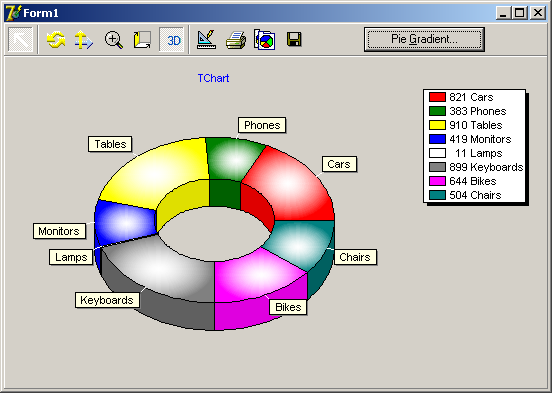
Pie and Donut series
- Gradient 3D property
Pie and Donut slices can now be filled in 3D mode, using a
Gradient
property.
Series1.Gradient.Visible:= True;

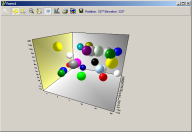
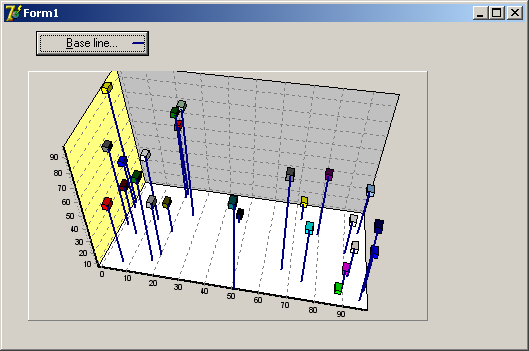
Point3D series
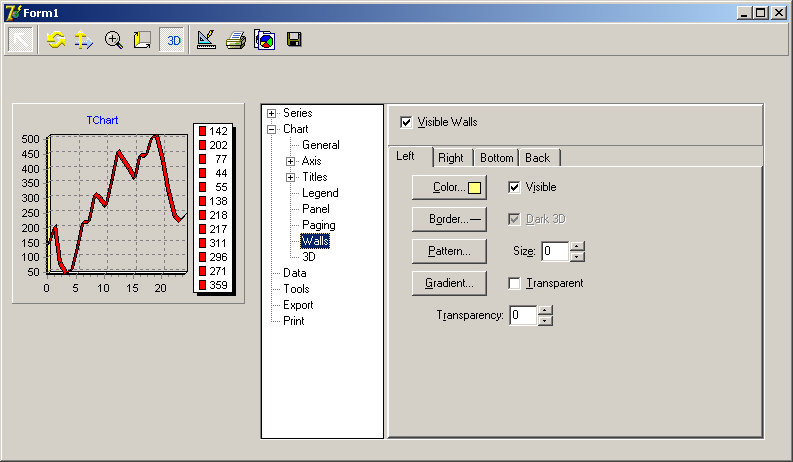
Chart Canvas
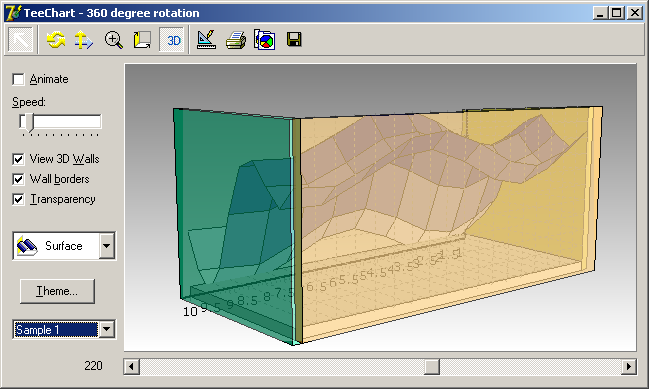
- Full 360 degree rotation in GDI mode
Last released version 6 provided 180 degree rotation in normal Windows GDI
mode.
Version 7 now delivers full 360 degree rotation, thus allowing viewing charts
from back perspective.
Chart1.View3DOptions.Rotation := 220 ; // back view

Chart Series Groups
Series can now be "grouped" in logical sets.
Any Series can be assigned to pertain to zero, one or more groups.
Series Groups are optionally displayed at Chart Editor dialog and ChartListBox
control.
var g1,g2:TSeriesGroup;
g1:=Chart1.SeriesList.AddGroup('First group');
g1.Series.Add(Series2);
g1.Series.Add(Series4);
g1.Series.Add(Series6);
g2:=Chart1.SeriesList.AddGroup('Second group');
g2.Series.Add(Series1);
g2.Series.Add(Series3);
g2.Series.Add(Series5);
ChartListBox1.SeriesGroup:=g1;
ChartEditor1.Options:= ChartEditor1.Options+[ceGroups];
ChartEditor1.Execute;
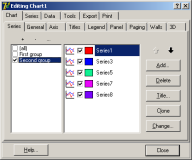
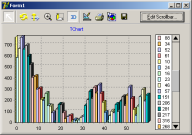
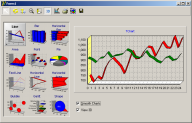
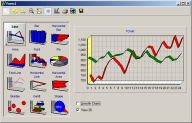
Chart Gallery
- Smoothing ( Based on "Resample" code from
Anders Melander and others )
New Chart Gallery option displays charts with "smoothing" effect.
ChartGalleryPanel1.Smooth:= True ;
Compare the two pictures below. The left one is showing a smooth gallery.
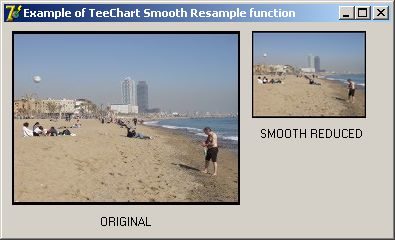
You can also use a global method to smooth your custom bitmap images.
uses TeCanvas;
var B : TBitmap;
begin
B:=TBitmap.Create;
try
B.Width:=Image1.Picture.Bitmap.Width div 2;
B.Height:=Image1.Picture.Bitmap.Height div 2;
SmoothStrecth(Image1.Picture.Bitmap, B);
Image2.Picture.Assign(B);
finally
B.Free;
end;
end;
Exporting Formats
- PDF improvements
The
TPDFCanvas object now provides several enhancements to
PDF
exporting.
A partnership with DynamicPDF company
offers server PDF charting and more.
- GIF and LZW compression Unisys patent.
According to Unisys at
http://www.unisys.com/about__unisys/lzw , patent on LZW compression has
expired worldwide except in some particular countries.
Check the above link to verify your license rights to use LZW compression in
your location.
The TeeChart version 7 now permits usage of LZW ( TeeGIF unit and editor
dialog ).
All Series with "Pointer" property
The TSeriesPointer class now includes a Transparency property.
Many series styles like Line, Area, Point, Point3D, Polar, Bubble, Gantt,
Bezier, etc have a Pointer property.
Series1.Pointer.Transparency := 50 ;
Candle and Arrow series, although providing a Pointer property, do not support
Transparency as they draw points using their own method.
All Series
New MandatoryAxis function
that returns the chart axis associated with the series (vertical axis in series
mandatory value list is Y, and horizontal axis in mandatory value list is X ).
Series1.MandatoryAxis.LabelsFont.Color := clRed ;
Chart SeriesList
property
New ClearValues method to
remove all values from all series in chart, thus leaving all series empty.
Chart1.SeriesList.ClearValues ;
TSmoothingFunction and TBSpline class
Removed limitation on number of source points to calculate smooth points.
(Fixed size arrays have been converted to dynamic arrays).
Warning: Smoothing more than 500 points can be a very slow
operation.
New Series styles
- Bubble3D, derived from
TPoint3D
series.
New bubble series that adds a "Z" value for each bubble point.
Requires OpenGL
rendering to correctly visualize solid 3D bubbles.
Fixed bugs
- TBollingerFunction
Calling Clear on series with Bollinger now clears the two Bollinger line
series instead of just one line.
- Canvas Custom drawing
Custom drawing could sometimes display text with shadows or outlines.
- Zoom pen
The Chart1.Zoom.Pen.SmallDots
property did not work.
- Canvas
EllipseWithZ and
Pie3D
methods
Improved distortion on big (ie: printed) Pie and Ellipse drawings.
- TCustom3DPaletteSeries
Fixed loosing the
PaletteStyle property when cloning series.
- Tower series
Added Assign method to support
cloning.
- Series1.DataSources
This property is now of type "TDataSourcesList" class.
Calling the Add, Delete and Clear methods will call the internal series
methods. This avoids an access violation when closing or destroying.
- Legend
When the legend is behind the chart (using Legend HorizMargin or VertMargin
properties), Chart1.OnClickSeries was not working correctly.
TeeTree2
- Teetree2 is now avialable for those who hold a current TeeChart Pro v7
license. This tree building component is a worthy addition for any developer
working with Delphi. Follow the link to find out more about
what TeeTree2 has
to offer.
|


