
|  | TeeChart, a Cross-browser HTML5 Canvas Charting
and Graphing Javascript library |

|
Welcome to TeeChart for HTML5 Builder
Mobile and Web Server Projects
Introduction:
TeeChart for HTML5 Builder is a RPCL library of controls that add charting capabilities to your Mobile and Web Server (PHP) projects.
The library consists of an RPCL package that includes design-time and run-time php modules.
Two controls are provided: Chart (for Page forms) and MChart (for Mobile Page forms), for both Client and Server applications.
Internally, the controls automatically generate Javascript code that uses TeeChart for JavaScript (teechart.js) script.
The TeeChart for Javascript runtime script generates live interactive charts at client-side inside the browser, using the <canvas> HTML5 element.
Adding Charts at design-time:
Simply drag a Chart or MChart control to your Page or MPage form surface, a default empty chart will be displayed:
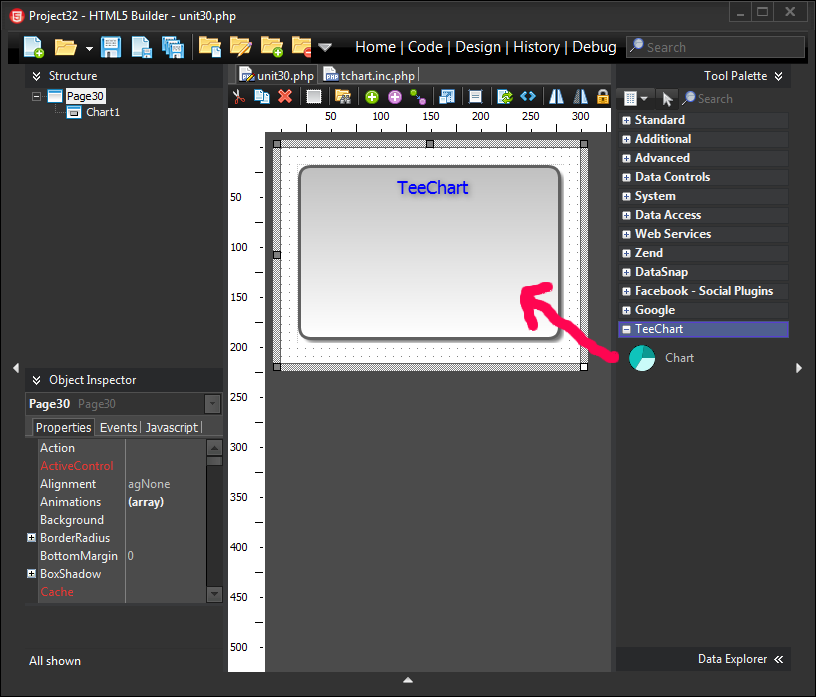 The Chart control provides several properties that can be customized at the Object Inspector.
These properties are persisted and compiled with your forms, no programming necessary.
The Chart control provides several properties that can be customized at the Object Inspector.
These properties are persisted and compiled with your forms, no programming necessary.
Adding data to Charts at design-time:
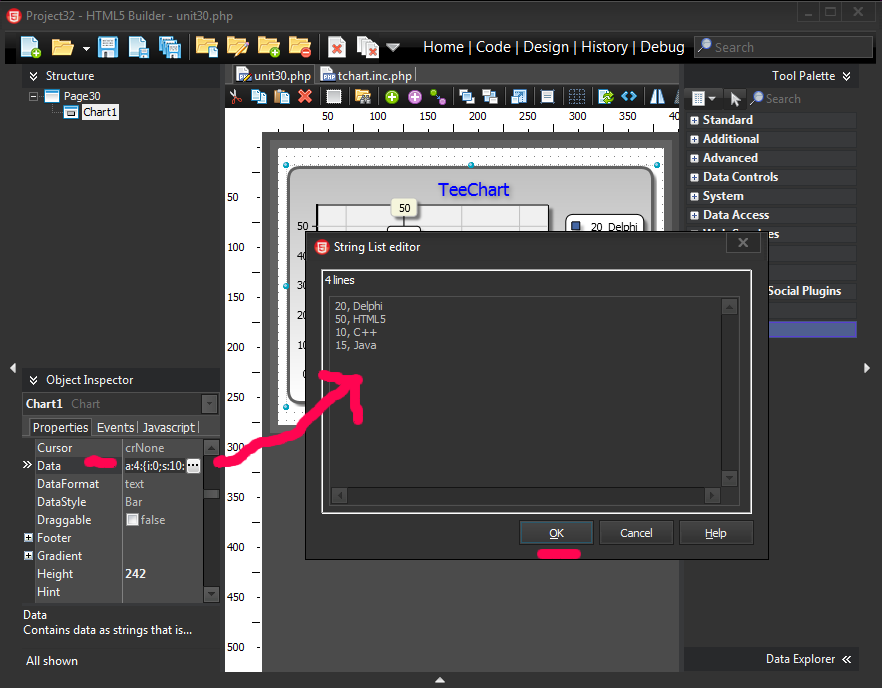
Data can be added to charts with no programming, by setting the Data property at the Object Inspector.
For example, select the Chart1 control, click the Object Inspector "..." button at Data property, and type some text (comma separated values)
 Click OK to close the strings editor dialog, and you'll then see the Chart1 control displays the entered data:
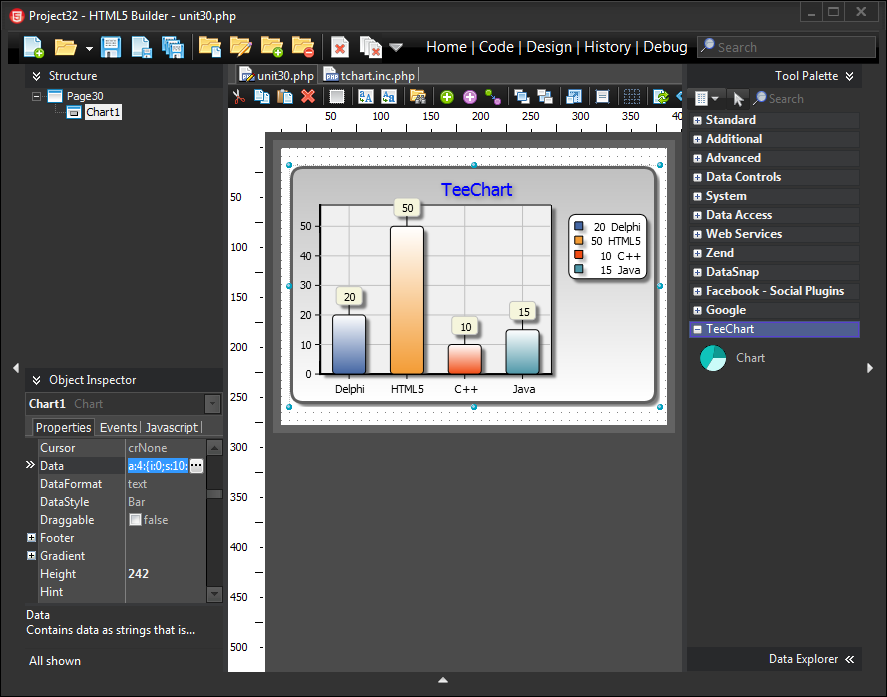 Several other properties are available at design-time, with more to come in future upgrades.
Manually coding:
The Chart control has a quite complex hierarchy of subobjects and subproperties.
All classes, properties and methods can be accessed by code both in PHP language (at server side) and Javascript (at client side).
Adding data to Charts manually at run-time:
Data can be added at runtime using either server-side PHP or client-side Javascript code.
For server side PHP, you can for example use the Chart Data property at Page OnCreate event, to reproduce the above chart we created at design-time:
    function Page1Create($sender, $params)
    {
      $this->Chart1->Data=array('20,Delphi','50,HTML5','10,C++','15,Java');
    }
And changing the chart style via the DataStyle property:
$this->Chart1->DataStyle="Pie";
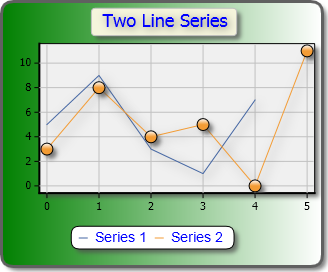
More than one series of data can exist in the same Chart, when adding them by code:
      $series1=$this->Chart1->addSeries(new TeeLine($this));
      $series1->Values=array(5,9,3,1,7);
      $series1->Title="Series 1";

      $series2=$this->Chart1->addSeries(new TeeLine($this));
      $series2->Values=array(3,8,4,5,0,11);
      $series2->Title="Series 2";
      $series2->Pointer->Visible=true;
Customizing Chart properties at run-time:
Each Chart element can be customized at a great level of detail, for example filling the chart background panel with a gradient of two colors:
$this->Chart1->Panel->Format->Gradient->Colors=array('red','yellow');
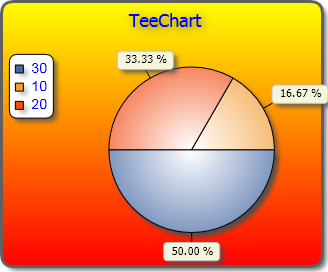
Another example, modifying several Legend attributes:
      $this->Chart1->Legend->Format->Font->Fill="blue";
      $this->Chart1->Legend->Format->Font->Style="14px Arial";
      $this->Chart1->Legend->Position="lpLeft";
And the resulting Chart is:
 The complete API reference can be found at this link.
For more information:
Please visit our web page to find out more documentation and demos:
TeeChart for HTML5 homepage
